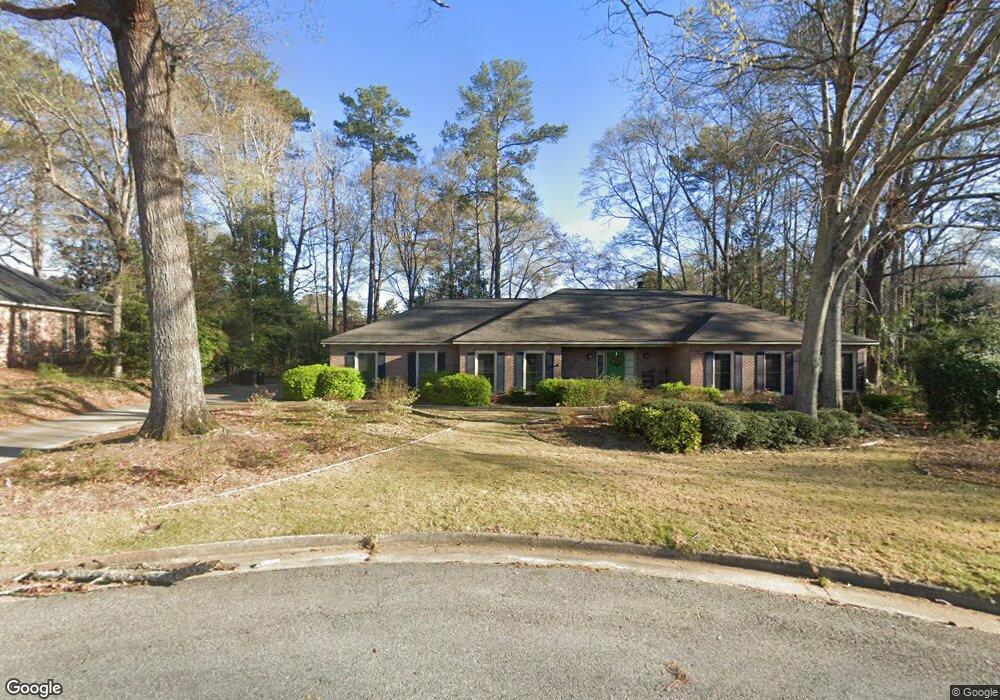
5133 E Timbalier Ct Columbus, GA 31907
Eastern Columbus NeighborhoodEstimated Value: $330,712 - $422,000
3
Beds
2
Baths
2,960
Sq Ft
$125/Sq Ft
Est. Value
About This Home
This home is located at 5133 E Timbalier Ct, Columbus, GA 31907 and is currently estimated at $370,928, approximately $125 per square foot. 5133 E Timbalier Ct is a home located in Muscogee County with nearby schools including Reese Road Leadership Academy, Midland Middle School, and Hardaway High School.
Ownership History
Date
Name
Owned For
Owner Type
Purchase Details
Closed on
Jun 29, 2016
Sold by
Martinez David J
Bought by
Graham Christopher A and Graham Ilana E
Current Estimated Value
Home Financials for this Owner
Home Financials are based on the most recent Mortgage that was taken out on this home.
Original Mortgage
$211,500
Outstanding Balance
$169,275
Interest Rate
3.66%
Estimated Equity
$201,653
Purchase Details
Closed on
Apr 9, 2015
Sold by
Erickson Kyle B
Bought by
Martinez David J and Andino Martinez Melinda
Home Financials for this Owner
Home Financials are based on the most recent Mortgage that was taken out on this home.
Original Mortgage
$224,730
Interest Rate
3.95%
Purchase Details
Closed on
Mar 31, 2011
Sold by
Yates William G
Bought by
Erickson Kyle B and Erickson Lesley A
Home Financials for this Owner
Home Financials are based on the most recent Mortgage that was taken out on this home.
Original Mortgage
$209,549
Interest Rate
4.37%
Mortgage Type
FHA
Create a Home Valuation Report for This Property
The Home Valuation Report is an in-depth analysis detailing your home's value as well as a comparison with similar homes in the area
Home Values in the Area
Average Home Value in this Area
Purchase History
| Date | Buyer | Sale Price | Title Company |
|---|---|---|---|
| Graham Christopher A | $235,000 | -- | |
| Martinez David J | $220,000 | -- | |
| Erickson Kyle B | $215,000 | -- |
Source: Public Records
Mortgage History
| Date | Status | Borrower | Loan Amount |
|---|---|---|---|
| Open | Graham Christopher A | $211,500 | |
| Previous Owner | Martinez David J | $224,730 | |
| Previous Owner | Erickson Kyle B | $209,549 |
Source: Public Records
Tax History Compared to Growth
Tax History
| Year | Tax Paid | Tax Assessment Tax Assessment Total Assessment is a certain percentage of the fair market value that is determined by local assessors to be the total taxable value of land and additions on the property. | Land | Improvement |
|---|---|---|---|---|
| 2025 | $3,061 | $110,440 | $21,080 | $89,360 |
| 2024 | $3,060 | $110,440 | $21,080 | $89,360 |
| 2023 | $2,385 | $110,440 | $21,080 | $89,360 |
| 2022 | $3,191 | $92,548 | $21,080 | $71,468 |
| 2021 | $3,184 | $91,380 | $21,080 | $70,300 |
| 2020 | $3,185 | $91,380 | $21,080 | $70,300 |
| 2019 | $3,197 | $91,380 | $21,080 | $70,300 |
| 2018 | $3,197 | $91,380 | $21,080 | $70,300 |
| 2017 | $3,209 | $91,380 | $21,080 | $70,300 |
| 2016 | $3,557 | $86,237 | $13,824 | $72,413 |
| 2015 | $3,004 | $86,000 | $13,824 | $72,176 |
| 2014 | $3,008 | $86,000 | $13,824 | $72,176 |
| 2013 | -- | $86,000 | $13,824 | $72,176 |
Source: Public Records
Map
Nearby Homes
- 5197 Kendal Ct
- 5031 Yosemite Dr
- 4975 Glacier Dr
- 4628 Sears Rd
- 5590 Macon Rd
- 3814 Pond View Ct
- 0 Bondale Dr Unit 11578793
- 4700 Bondale Dr
- 3053 Reese Rd
- 4120 Fairview Dr
- 3521 Willow Bend Run
- 4732 Delfair Dr
- 2 Hidden Woods Ct
- 5260 Woodruff Farm Rd
- 5018 Woodruff Farm Rd
- 2951 Florence Dr
- 4635 Delfair Dr
- 4524 Hedingham Ln
- 4931 Woodruff Farm Rd
- 3409 Ambassador Dr
- 5136 E Timbalier Ct
- 3 Granby Ct
- 5123 E Timbalier Ct
- 2 Granby Ct
- 4425 Bentwood Dr
- 5130 E Timbalier Ct
- 4417 Bentwood Dr
- 5124 E Timbalier Ct
- 5113 E Timbalier Ct
- 4516 Sears Rd
- 4526 Sears Rd
- 4 Granby Ct
- 4409 Bentwood Dr
- 5112 E Timbalier Ct
- 4508 Sears Rd
- 0 Bentwood Dr
- 5235 Pine Needle Dr
- 4540 Sears Rd
- 5225 Pine Needle Dr
- 5251 Pine Needle Dr