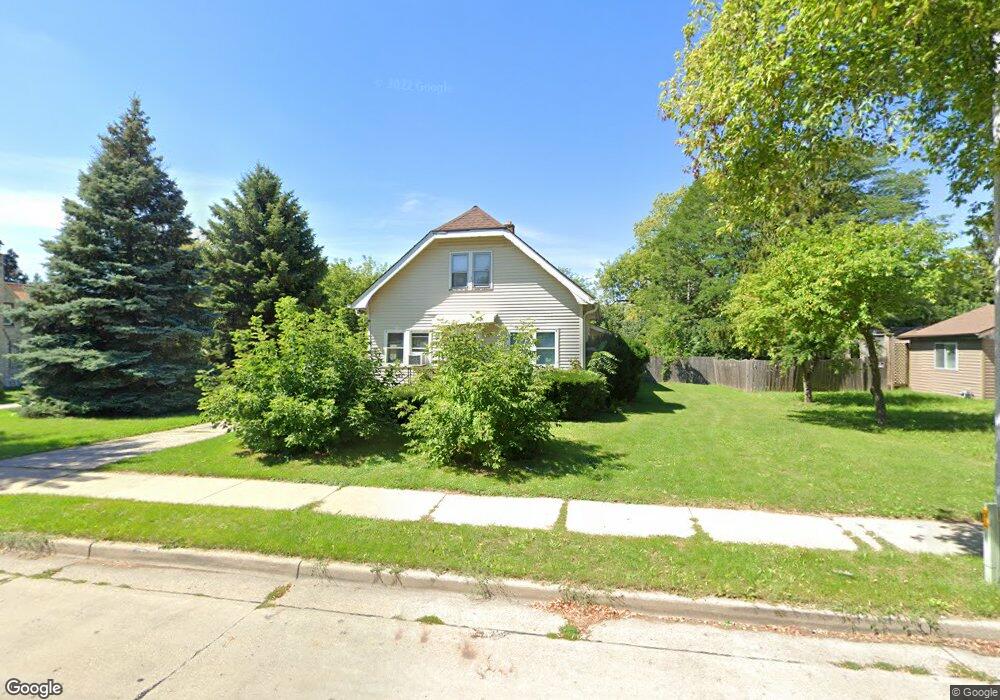
5133 N 61st St Milwaukee, WI 53218
Hampton Heights NeighborhoodEstimated Value: $136,000 - $189,394
3
Beds
1
Bath
1,080
Sq Ft
$150/Sq Ft
Est. Value
About This Home
This home is located at 5133 N 61st St, Milwaukee, WI 53218 and is currently estimated at $161,599, approximately $149 per square foot. 5133 N 61st St is a home located in Milwaukee County with nearby schools including Craig Montessori School, Milwaukee German Immersion School, and La Escuela Fratney.
Ownership History
Date
Name
Owned For
Owner Type
Purchase Details
Closed on
Mar 7, 2003
Sold by
Knippel Marie E
Bought by
Wholf Michael L and Wholf Sandra D
Current Estimated Value
Home Financials for this Owner
Home Financials are based on the most recent Mortgage that was taken out on this home.
Original Mortgage
$83,850
Outstanding Balance
$43,718
Interest Rate
8.87%
Mortgage Type
Purchase Money Mortgage
Estimated Equity
$117,881
Create a Home Valuation Report for This Property
The Home Valuation Report is an in-depth analysis detailing your home's value as well as a comparison with similar homes in the area
Home Values in the Area
Average Home Value in this Area
Purchase History
| Date | Buyer | Sale Price | Title Company |
|---|---|---|---|
| Wholf Michael L | $83,900 | -- |
Source: Public Records
Mortgage History
| Date | Status | Borrower | Loan Amount |
|---|---|---|---|
| Open | Wholf Michael L | $83,850 |
Source: Public Records
Tax History Compared to Growth
Tax History
| Year | Tax Paid | Tax Assessment Tax Assessment Total Assessment is a certain percentage of the fair market value that is determined by local assessors to be the total taxable value of land and additions on the property. | Land | Improvement |
|---|---|---|---|---|
| 2024 | $2,808 | $138,500 | $5,400 | $133,100 |
| 2023 | $2,415 | $102,200 | $5,400 | $96,800 |
| 2022 | $2,118 | $102,200 | $5,400 | $96,800 |
| 2021 | $1,568 | $71,700 | $5,400 | $66,300 |
| 2020 | $1,618 | $71,700 | $5,400 | $66,300 |
| 2019 | $3,150 | $63,500 | $6,000 | $57,500 |
| 2018 | $4,532 | $63,500 | $6,000 | $57,500 |
| 2017 | $5,268 | $63,500 | $8,100 | $55,400 |
| 2016 | $4,387 | $62,500 | $8,100 | $54,400 |
| 2015 | $3,854 | $61,200 | $8,100 | $53,100 |
| 2014 | $3,406 | $61,200 | $8,100 | $53,100 |
| 2013 | -- | $65,800 | $8,100 | $57,700 |
Source: Public Records
Map
Nearby Homes