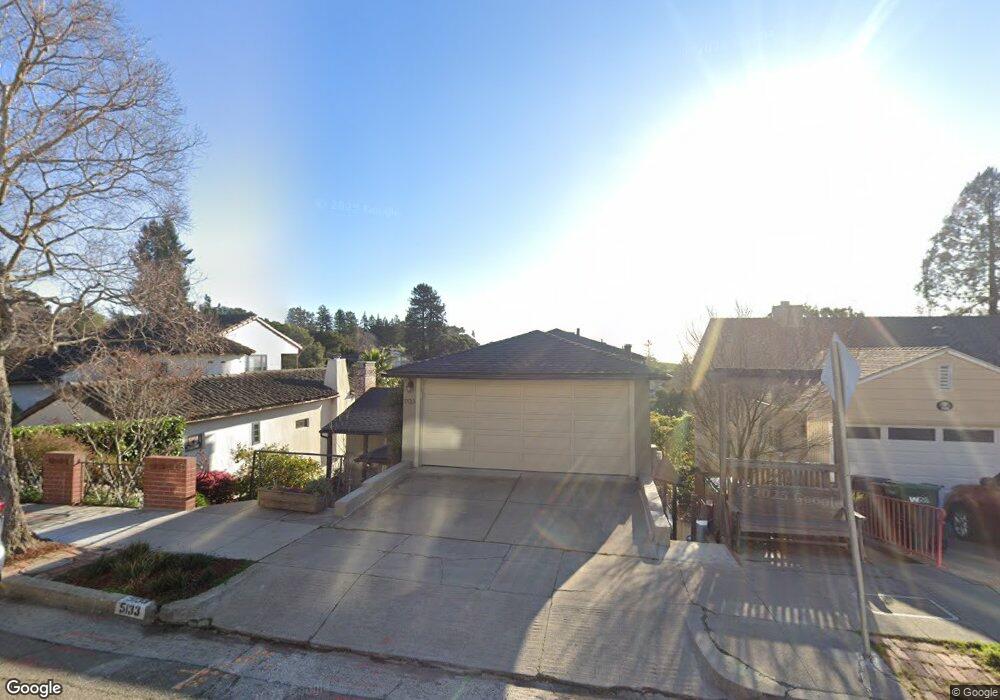
5133 Proctor Ave Oakland, CA 94618
Upper Rockridge NeighborhoodEstimated Value: $1,325,429 - $1,689,000
3
Beds
2
Baths
1,794
Sq Ft
$832/Sq Ft
Est. Value
About This Home
This home is located at 5133 Proctor Ave, Oakland, CA 94618 and is currently estimated at $1,492,857, approximately $832 per square foot. 5133 Proctor Ave is a home located in Alameda County with nearby schools including Hillcrest Elementary School, Skyline High School, and St. Theresa School.
Ownership History
Date
Name
Owned For
Owner Type
Purchase Details
Closed on
Sep 22, 2004
Sold by
Wagener Bennett Paul V and Wagener Bennett Laura
Bought by
Bennett Paul V and Bennett Laura W
Current Estimated Value
Create a Home Valuation Report for This Property
The Home Valuation Report is an in-depth analysis detailing your home's value as well as a comparison with similar homes in the area
Home Values in the Area
Average Home Value in this Area
Purchase History
| Date | Buyer | Sale Price | Title Company |
|---|---|---|---|
| Bennett Paul V | -- | -- |
Source: Public Records
Tax History
| Year | Tax Paid | Tax Assessment Tax Assessment Total Assessment is a certain percentage of the fair market value that is determined by local assessors to be the total taxable value of land and additions on the property. | Land | Improvement |
|---|---|---|---|---|
| 2025 | $7,638 | $461,245 | $237,792 | $230,453 |
| 2024 | $7,638 | $452,064 | $233,130 | $225,934 |
| 2023 | $7,963 | $450,062 | $228,558 | $221,504 |
| 2022 | $7,727 | $434,239 | $224,077 | $217,162 |
| 2021 | $7,153 | $425,588 | $219,684 | $212,904 |
| 2020 | $7,076 | $428,153 | $217,432 | $210,721 |
| 2019 | $6,781 | $419,759 | $213,169 | $206,590 |
| 2018 | $6,645 | $411,530 | $208,990 | $202,540 |
| 2017 | $6,381 | $403,462 | $204,893 | $198,569 |
| 2016 | $6,143 | $395,552 | $200,876 | $194,676 |
| 2015 | $6,113 | $389,611 | $197,859 | $191,752 |
| 2014 | $6,156 | $381,979 | $193,983 | $187,996 |
Source: Public Records
Map
Nearby Homes
- 209 Sheridan Rd
- 4951 Proctor Ave
- 5430 Proctor Ave
- 1101 Mountain Blvd
- 100 Sonia St
- 936 Mountain Blvd
- 0 Ruthland Rd Unit 41117159
- 0 Ruthland Rd Unit 41119108
- 233 Capricorn Ave
- 4715 Proctor Ave
- 942 Aquarius Way
- 6356 Broadway Terrace
- 97 Clarewood Ln
- 5630 Moraga Ave
- 5 Abbott Way
- 6257 Virgo Rd
- 5716 Merriewood Dr
- 633 Moraga Ave
- 5900 Marden Ln
- 19 Monte Ave
- 5141 Proctor Ave
- 5125 Proctor Ave
- 5201 Proctor Ave
- 5117 Proctor Ave
- 488 Florence Ave
- 496 Florence Ave
- 5209 Proctor Ave
- 5109 Proctor Ave
- 484 Florence Ave
- 500 Florence Ave
- 5132 Proctor Ave
- 5140 Proctor Ave
- 5124 Proctor Ave
- 0 Florence Ave
- 5200 Proctor Ave
- 518 Florence Ave
- 476 Florence Ave
- 5217 Proctor Ave
- 5112 Proctor Ave
- 5101 Proctor Ave
Your Personal Tour Guide
Ask me questions while you tour the home.