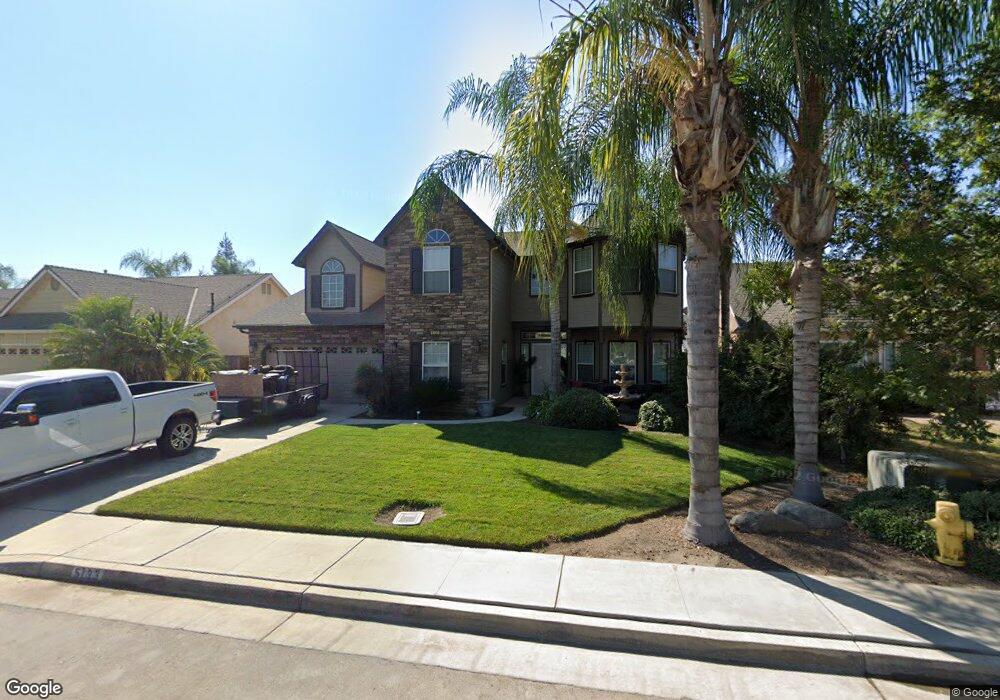
5133 W Oriole Ave Visalia, CA 93291
Northwest Visalia NeighborhoodEstimated Value: $594,000 - $712,000
4
Beds
3
Baths
2,895
Sq Ft
$222/Sq Ft
Est. Value
About This Home
This home is located at 5133 W Oriole Ave, Visalia, CA 93291 and is currently estimated at $641,311, approximately $221 per square foot. 5133 W Oriole Ave is a home located in Tulare County with nearby schools including Oak Grove Elementary, Ridgeview Middle, and Redwood High School.
Ownership History
Date
Name
Owned For
Owner Type
Purchase Details
Closed on
Sep 21, 2016
Sold by
Herron Bnan K
Bought by
Herron Brian and Herron Christy
Current Estimated Value
Home Financials for this Owner
Home Financials are based on the most recent Mortgage that was taken out on this home.
Original Mortgage
$296,000
Outstanding Balance
$236,585
Interest Rate
3.45%
Mortgage Type
New Conventional
Estimated Equity
$404,726
Purchase Details
Closed on
May 20, 2015
Sold by
Reynoso Ranulfo
Bought by
Moncada Julieta
Home Financials for this Owner
Home Financials are based on the most recent Mortgage that was taken out on this home.
Original Mortgage
$246,050
Interest Rate
3.62%
Mortgage Type
New Conventional
Purchase Details
Closed on
Oct 1, 2005
Sold by
Lennar Fresno Inc
Bought by
Herron Brian K and Herron Christy D
Home Financials for this Owner
Home Financials are based on the most recent Mortgage that was taken out on this home.
Original Mortgage
$315,200
Interest Rate
1%
Mortgage Type
Fannie Mae Freddie Mac
Create a Home Valuation Report for This Property
The Home Valuation Report is an in-depth analysis detailing your home's value as well as a comparison with similar homes in the area
Home Values in the Area
Average Home Value in this Area
Purchase History
| Date | Buyer | Sale Price | Title Company |
|---|---|---|---|
| Herron Brian | -- | Stewart Title Of Ca Inc | |
| Moncada Julieta | $259,000 | Chicago Title Company | |
| Herron Brian K | $394,500 | North American Title Co |
Source: Public Records
Mortgage History
| Date | Status | Borrower | Loan Amount |
|---|---|---|---|
| Open | Herron Brian | $296,000 | |
| Closed | Moncada Julieta | $246,050 | |
| Previous Owner | Herron Brian K | $315,200 |
Source: Public Records
Tax History Compared to Growth
Tax History
| Year | Tax Paid | Tax Assessment Tax Assessment Total Assessment is a certain percentage of the fair market value that is determined by local assessors to be the total taxable value of land and additions on the property. | Land | Improvement |
|---|---|---|---|---|
| 2025 | $6,135 | $572,597 | $136,657 | $435,940 |
| 2024 | $6,135 | $561,371 | $133,978 | $427,393 |
| 2023 | $5,961 | $550,364 | $131,351 | $419,013 |
| 2022 | $5,773 | $539,574 | $128,776 | $410,798 |
| 2021 | $4,994 | $463,000 | $116,000 | $347,000 |
| 2020 | $4,078 | $376,000 | $94,000 | $282,000 |
| 2019 | $3,768 | $351,000 | $88,000 | $263,000 |
| 2018 | $3,498 | $327,000 | $82,000 | $245,000 |
| 2017 | $3,639 | $339,000 | $85,000 | $254,000 |
| 2016 | $3,270 | $304,000 | $76,000 | $228,000 |
| 2015 | $3,250 | $301,000 | $75,000 | $226,000 |
| 2014 | $3,182 | $295,000 | $74,000 | $221,000 |
Source: Public Records
Map
Nearby Homes
- 5222 W Lark Ct
- 5045 W Modoc Ave
- 4812 W Wren Ave
- Sydney Plan at Sycamore Ranch
- Carrera Plan at Sycamore Ranch
- Aspen Plan at Sycamore Ranch
- Carlton Plan at Sycamore Ranch
- Naples Plan at Sycamore Ranch
- Marsala Plan at Sycamore Ranch
- Aspen with Loft Plan at Sycamore Ranch
- Verona with Loft Plan at Sycamore Ranch
- 4638 W Lark Ct
- 3220 N Noyes Ct
- 2318 N Hilton St Unit Syc27
- 2318 N Hilton St
- 4629 W Prescott Ct
- 4613 W Payson Ct
- 2250 Hilton St
- 2250 N Hilton St Unit Syc29
- 5515 W Sunnyview Ave
- 5125 W Oriole Ave
- 5201 W Oriole Ave
- 5117 W Oriole Ave
- 5221 W Oriole Ave
- 5136 W Wren Ct
- 5128 W Wren Ct
- 5206 W Wren Ct
- 5116 W Wren Ct
- 5218 W Wren Ct
- 5132 W Oriole Ave
- 5202 W Oriole Ave
- 5239 W Oriole Ave
- 5105 W Oriole Ave
- 5124 W Oriole Ave
- 5224 W Oriole Ave
- 5226 W Wren Ct
- 5118 W Oriole Ave
- 5104 W Wren Ct
- 5236 W Oriole Ave Unit 1
- 5236 W Oriole Ave