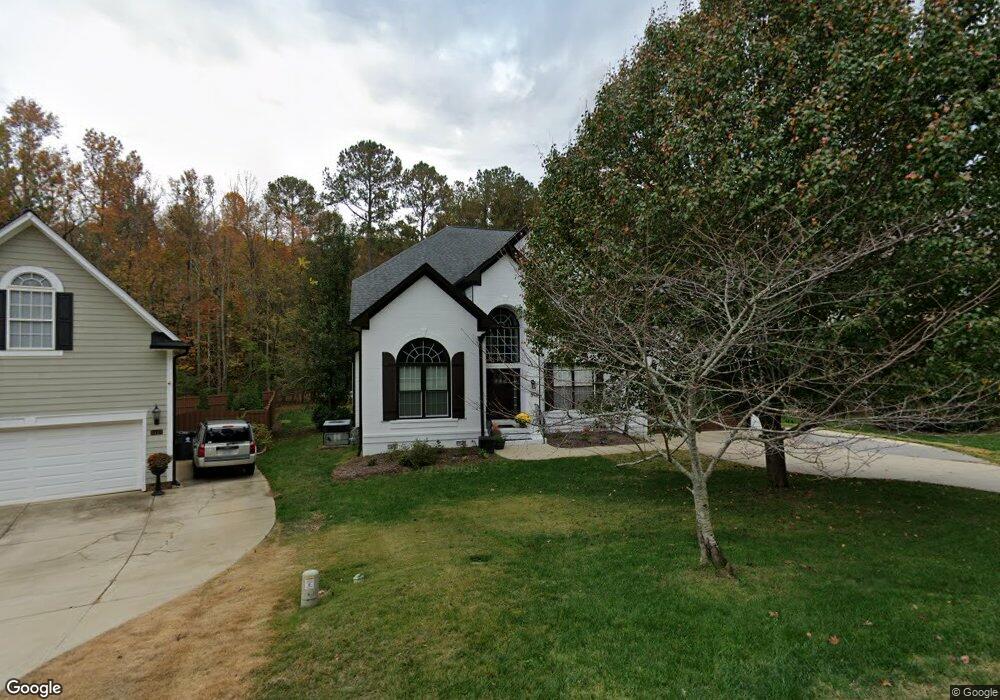
5136 Bartons Enclave Ln Raleigh, NC 27613
Estimated Value: $785,247 - $888,000
4
Beds
3
Baths
3,260
Sq Ft
$260/Sq Ft
Est. Value
About This Home
This home is located at 5136 Bartons Enclave Ln, Raleigh, NC 27613 and is currently estimated at $848,562, approximately $260 per square foot. 5136 Bartons Enclave Ln is a home located in Wake County with nearby schools including Pine Hollow Middle School, Leesville Road High School, and The Franciscan School.
Ownership History
Date
Name
Owned For
Owner Type
Purchase Details
Closed on
Aug 1, 2006
Sold by
Riebe Michael T and Riebe Denise
Bought by
Hoffman David A and Hoffman Sarah M
Current Estimated Value
Home Financials for this Owner
Home Financials are based on the most recent Mortgage that was taken out on this home.
Original Mortgage
$311,000
Interest Rate
6.16%
Mortgage Type
Purchase Money Mortgage
Purchase Details
Closed on
Nov 16, 2005
Sold by
Riebe Michael T and Riebe Denise
Bought by
Riebe Michael T and Riebe Denise
Purchase Details
Closed on
Oct 30, 2001
Sold by
Weekley Homes Lp
Bought by
Riebe Michael T
Home Financials for this Owner
Home Financials are based on the most recent Mortgage that was taken out on this home.
Original Mortgage
$264,000
Interest Rate
6.74%
Create a Home Valuation Report for This Property
The Home Valuation Report is an in-depth analysis detailing your home's value as well as a comparison with similar homes in the area
Home Values in the Area
Average Home Value in this Area
Purchase History
| Date | Buyer | Sale Price | Title Company |
|---|---|---|---|
| Hoffman David A | $393,000 | None Available | |
| Riebe Michael T | -- | None Available | |
| Riebe Michael T | $360,000 | -- |
Source: Public Records
Mortgage History
| Date | Status | Borrower | Loan Amount |
|---|---|---|---|
| Previous Owner | Hoffman David A | $311,000 | |
| Previous Owner | Riebe Michael T | $264,000 |
Source: Public Records
Tax History Compared to Growth
Tax History
| Year | Tax Paid | Tax Assessment Tax Assessment Total Assessment is a certain percentage of the fair market value that is determined by local assessors to be the total taxable value of land and additions on the property. | Land | Improvement |
|---|---|---|---|---|
| 2025 | $4,821 | $750,553 | $120,000 | $630,553 |
| 2024 | $4,681 | $750,553 | $120,000 | $630,553 |
| 2023 | $3,755 | $479,022 | $100,000 | $379,022 |
| 2022 | $3,480 | $479,022 | $100,000 | $379,022 |
| 2021 | $3,386 | $479,022 | $100,000 | $379,022 |
| 2020 | $3,330 | $479,022 | $100,000 | $379,022 |
| 2019 | $3,297 | $401,245 | $110,000 | $291,245 |
| 2018 | $2,931 | $387,972 | $110,000 | $277,972 |
| 2017 | $2,778 | $387,972 | $110,000 | $277,972 |
| 2016 | $2,722 | $387,972 | $110,000 | $277,972 |
| 2015 | $2,886 | $412,680 | $106,000 | $306,680 |
| 2014 | -- | $412,680 | $106,000 | $306,680 |
Source: Public Records
Map
Nearby Homes
- 5240 Indigo Moon Way
- 5020 Red Cedar Rd
- 11209 Sedgefield Dr
- 11913 Eagle Bluff Cir
- 11953 Eagle Cliff Ct
- 2729 Sunnystone Way
- 12316 Amoretto Way
- 11804 Mountbatten Way
- Harlow Plan at Bayberry
- 5216 Sutter Way
- 5000 Morning Edge Dr
- 5906 Dunzo Dr
- 5952 Dunzo Dr
- 5956 Dunzo Dr
- 5900 Dunzo Dr
- 5904 Dunzo Dr
- 5902 Dunzo Dr
- 6040 Dunzo Dr
- 6108 Dunzo Dr
- 5528 Hawthorne Park
- 5132 Bartons Enclave Ln
- 5140 Bartons Enclave Ln
- 5144 Bartons Enclave Ln
- 5128 Bartons Enclave Ln
- 5148 Bartons Enclave Ln
- 5124 Bartons Enclave Ln
- 5145 Bartons Enclave Ln
- 5120 Bartons Enclave Ln
- 5152 Bartons Enclave Ln
- 5149 Bartons Enclave Ln
- 5116 Bartons Enclave Ln
- 5113 Bartons Enclave Ln
- 5133 Watkinsdale Ave
- 5112 Bartons Enclave Ln
- 5236 Indigo Moon Way
- 5154 Bartons Enclave Ln
- 5141 Watkinsdale Ave
- 5153 Bartons Enclave Ln
- 5308 Indigo Moon Way
- 5108 Bartons Enclave Ln