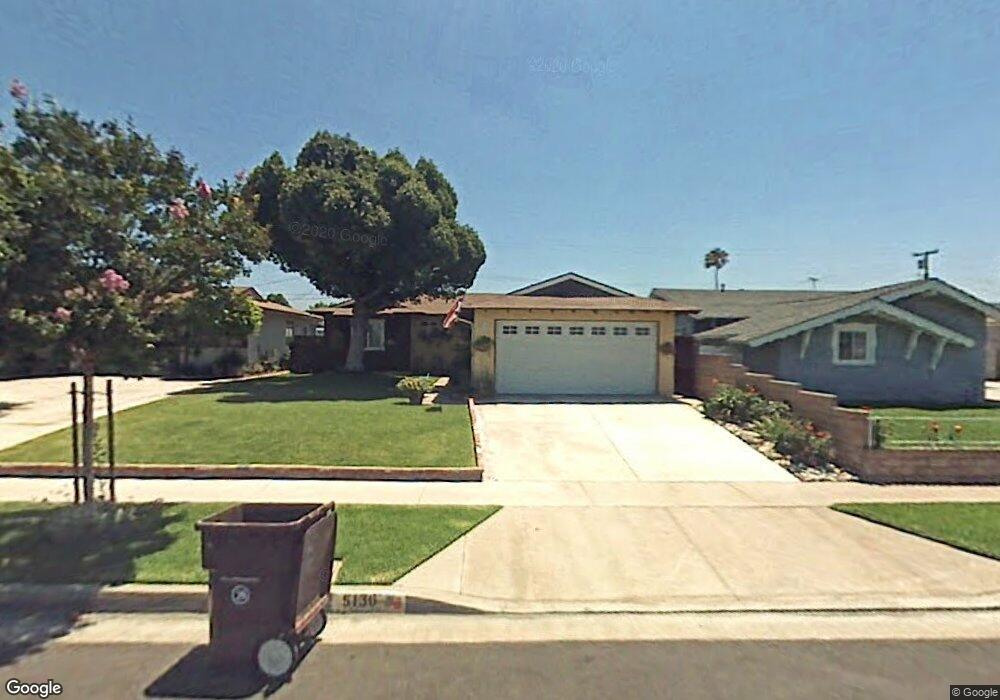
5136 N Varnell Ave Covina, CA 91722
South Azusa NeighborhoodEstimated Value: $746,715 - $813,000
3
Beds
2
Baths
1,378
Sq Ft
$557/Sq Ft
Est. Value
About This Home
This home is located at 5136 N Varnell Ave, Covina, CA 91722 and is currently estimated at $767,179, approximately $556 per square foot. 5136 N Varnell Ave is a home located in Los Angeles County with nearby schools including Alice M. Ellington Elementary School, Gladstone High School, and Center Middle School.
Ownership History
Date
Name
Owned For
Owner Type
Purchase Details
Closed on
Nov 23, 2021
Sold by
Mendoza Leslie C Word and Mendoza Phillip V
Bought by
Leslie C Word-Mendoza Living Trust
Current Estimated Value
Purchase Details
Closed on
Feb 16, 2011
Sold by
Word Mendoza Leslie C
Bought by
Word Mendoza Leslie C and Leslie Word Mendoza Living Trust 2011
Purchase Details
Closed on
Oct 18, 1999
Sold by
Mendoza Phillip V
Bought by
Word Mendoza Leslie C
Home Financials for this Owner
Home Financials are based on the most recent Mortgage that was taken out on this home.
Original Mortgage
$144,400
Interest Rate
7.82%
Purchase Details
Closed on
Oct 11, 1999
Sold by
Vande Car Marleene
Bought by
Word Mendoza Leslie C
Home Financials for this Owner
Home Financials are based on the most recent Mortgage that was taken out on this home.
Original Mortgage
$144,400
Interest Rate
7.82%
Create a Home Valuation Report for This Property
The Home Valuation Report is an in-depth analysis detailing your home's value as well as a comparison with similar homes in the area
Home Values in the Area
Average Home Value in this Area
Purchase History
| Date | Buyer | Sale Price | Title Company |
|---|---|---|---|
| Leslie C Word-Mendoza Living Trust | -- | Accommodation/Courtesy Recordi | |
| Word Mendoza Leslie C | -- | None Available | |
| Word Mendoza Leslie C | -- | North American Title | |
| Word Mendoza Leslie C | $152,000 | North American Title |
Source: Public Records
Mortgage History
| Date | Status | Borrower | Loan Amount |
|---|---|---|---|
| Previous Owner | Word Mendoza Leslie C | $144,400 |
Source: Public Records
Tax History
| Year | Tax Paid | Tax Assessment Tax Assessment Total Assessment is a certain percentage of the fair market value that is determined by local assessors to be the total taxable value of land and additions on the property. | Land | Improvement |
|---|---|---|---|---|
| 2025 | $3,285 | $233,598 | $143,236 | $90,362 |
| 2024 | $3,149 | $229,019 | $140,428 | $88,591 |
| 2023 | $3,061 | $224,529 | $137,675 | $86,854 |
| 2022 | $3,021 | $220,127 | $134,976 | $85,151 |
| 2021 | $4,944 | $215,812 | $132,330 | $83,482 |
| 2019 | $4,851 | $209,412 | $128,406 | $81,006 |
| 2018 | $4,693 | $205,307 | $125,889 | $79,418 |
| 2016 | $4,585 | $197,336 | $121,001 | $76,335 |
| 2015 | $2,552 | $194,373 | $119,184 | $75,189 |
| 2014 | $2,401 | $190,567 | $116,850 | $73,717 |
Source: Public Records
Map
Nearby Homes
- 1081 W Arrow Hwy Unit 96
- 1081 W Arrow Hwy Unit 46
- 1191 E Laxford Rd
- 4850 N Vincent Ave
- 16569 E Masline St
- 4810 N Vincent Ave
- 16716 E Renwick Rd
- 16624 E Benwood St
- 5527 N Gareloch Ave
- 17141 E Tudor St
- 17049 E Orkney St
- 17104 E Orkney St
- 600 W Gladstone St Unit 45
- 717 S Azusa Ave Unit C
- 16151 E Kingside Dr
- 713 S Azusa Ave Unit A
- 349 S Enid Ave
- 707 S Azusa Ave Unit B
- 4455 N Lark Ellen Ln
- 415 S Grandin Ave
- 5142 N Varnell Ave
- 5130 N Varnell Ave
- 5146 N Varnell Ave
- 5126 N Varnell Ave
- 5141 N Saint Malo Ave
- 5153 N Saint Malo Ave
- 5135 N Saint Malo Ave
- 5157 N Saint Malo Ave
- 5152 N Varnell Ave
- 5118 N Varnell Ave
- 5135 N Varnell Ave
- 5139 N Varnell Ave
- 5129 N Varnell Ave
- 5145 N Varnell Ave
- 5131 N Saint Malo Ave
- 5163 N Saint Malo Ave
- 5125 N Varnell Ave
- 5156 N Varnell Ave
- 5149 N Varnell Ave
- 5114 N Varnell Ave
Your Personal Tour Guide
Ask me questions while you tour the home.