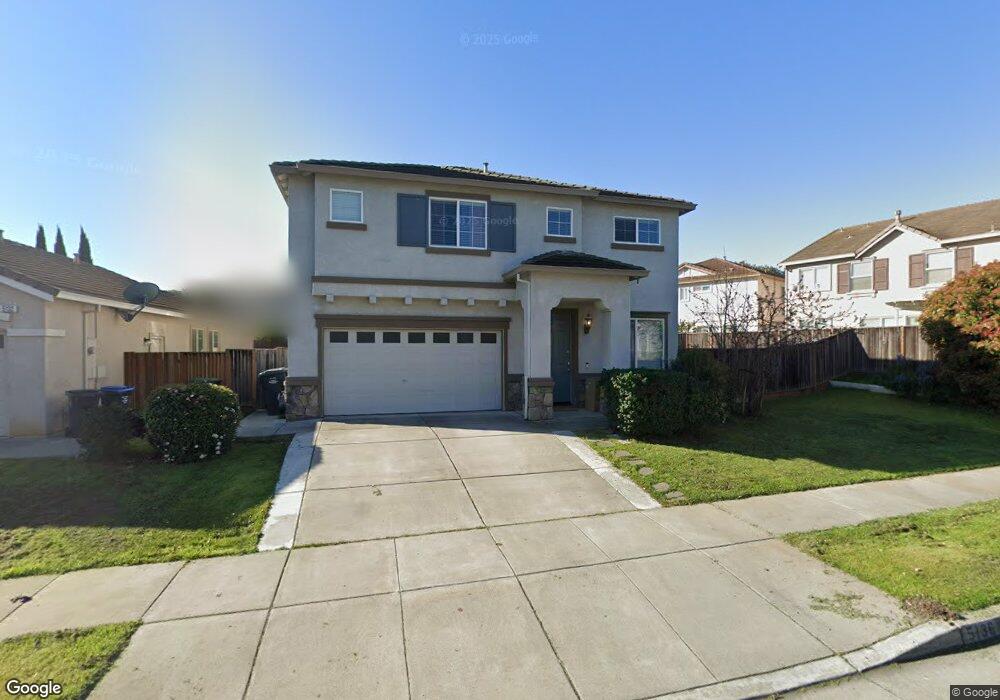
5136 Pond Side Way Fairfield, CA 94534
Estimated Value: $614,000 - $783,000
4
Beds
3
Baths
2,248
Sq Ft
$304/Sq Ft
Est. Value
About This Home
This home is located at 5136 Pond Side Way, Fairfield, CA 94534 and is currently estimated at $682,838, approximately $303 per square foot. 5136 Pond Side Way is a home located in Solano County with nearby schools including Oakbrook Academy of the Arts, Green Valley Middle School, and Angelo Rodriguez High School.
Ownership History
Date
Name
Owned For
Owner Type
Purchase Details
Closed on
Apr 28, 2017
Sold by
2014-1 1H Borrower Lp
Bought by
Thr California Lp
Current Estimated Value
Purchase Details
Closed on
May 30, 2014
Sold by
Thr California Lp
Bought by
2014-1 Ih Borrower Lp
Home Financials for this Owner
Home Financials are based on the most recent Mortgage that was taken out on this home.
Original Mortgage
$993,738,000
Interest Rate
4.17%
Mortgage Type
Purchase Money Mortgage
Purchase Details
Closed on
Oct 15, 2012
Sold by
Magtanong Patricia and Magtanong Dave
Bought by
Thr California Lp
Purchase Details
Closed on
Mar 25, 2004
Sold by
Albert D Seeno Construction Co
Bought by
Magtanong Dave and Magtanong Patricia
Home Financials for this Owner
Home Financials are based on the most recent Mortgage that was taken out on this home.
Original Mortgage
$362,736
Interest Rate
4.62%
Mortgage Type
Purchase Money Mortgage
Create a Home Valuation Report for This Property
The Home Valuation Report is an in-depth analysis detailing your home's value as well as a comparison with similar homes in the area
Purchase History
| Date | Buyer | Sale Price | Title Company |
|---|---|---|---|
| Thr California Lp | -- | None Available | |
| 2014-1 Ih Borrower Lp | -- | None Available | |
| Thr California Lp | $265,000 | None Available | |
| Magtanong Dave | $453,500 | Frontier Title Co |
Source: Public Records
Mortgage History
| Date | Status | Borrower | Loan Amount |
|---|---|---|---|
| Previous Owner | 2014-1 Ih Borrower Lp | $993,738,000 | |
| Previous Owner | Magtanong Dave | $362,736 | |
| Closed | Magtanong Dave | $68,013 |
Source: Public Records
Tax History
| Year | Tax Paid | Tax Assessment Tax Assessment Total Assessment is a certain percentage of the fair market value that is determined by local assessors to be the total taxable value of land and additions on the property. | Land | Improvement |
|---|---|---|---|---|
| 2025 | $6,404 | $522,837 | $174,085 | $348,752 |
| 2024 | $6,404 | $512,586 | $170,672 | $341,914 |
| 2023 | $6,104 | $502,536 | $167,326 | $335,210 |
| 2022 | $5,964 | $492,684 | $164,046 | $328,638 |
| 2021 | $5,994 | $483,025 | $160,830 | $322,195 |
| 2020 | $5,859 | $478,073 | $159,181 | $318,892 |
| 2019 | $5,659 | $468,700 | $156,060 | $312,640 |
| 2018 | $5,827 | $459,510 | $153,000 | $306,510 |
| 2017 | $3,513 | $270,562 | $57,294 | $213,268 |
| 2016 | $3,484 | $265,258 | $56,171 | $209,087 |
| 2015 | $3,276 | $261,275 | $55,328 | $205,947 |
| 2014 | $3,247 | $256,158 | $54,245 | $201,913 |
Source: Public Records
Map
Nearby Homes
- 5227 Waterleaf Ln
- 680 Silver Lake Dr
- 4924 Fairmont Ct
- 680 Vintage Ct
- 741 Greentree Cir
- 5100 Ramsgate Ct
- 0 McGary Rd Unit 325089430
- 848 Crescendo St
- 4817 Dolce Ct
- 4732 Opus Cir
- 5305 Gather Way
- 1132 Courtland Ct
- 5257 Venus Dr
- 5210 Palladio Way
- 4455 Meadow Valley Cir
- 4764 Brookside Cir
- 4413 Meadow Valley Cir
- 4109 Cedarvale Ct
- 5244 Tuscany Dr
- 4758 Antelope Cir
- 5132 Pond Side Way
- 510 River Rd
- 504 River Rd
- 518 River Rd
- 5128 Pond Side Way
- 526 River Rd
- 532 River Rd
- 5137 Pond Side Way
- 5124 Pond Side Way
- 5133 Pond Side Way
- 538 River Rd
- 5141 Pond Side Way
- 5129 Pond Side Way
- 5145 Pond Side Way
- 544 River Rd
- 5125 Pond Side Way
- 5120 Pond Side Way
- 5121 Pond Side Way
- 505 River Rd
- 517 River Rd
Your Personal Tour Guide
Ask me questions while you tour the home.