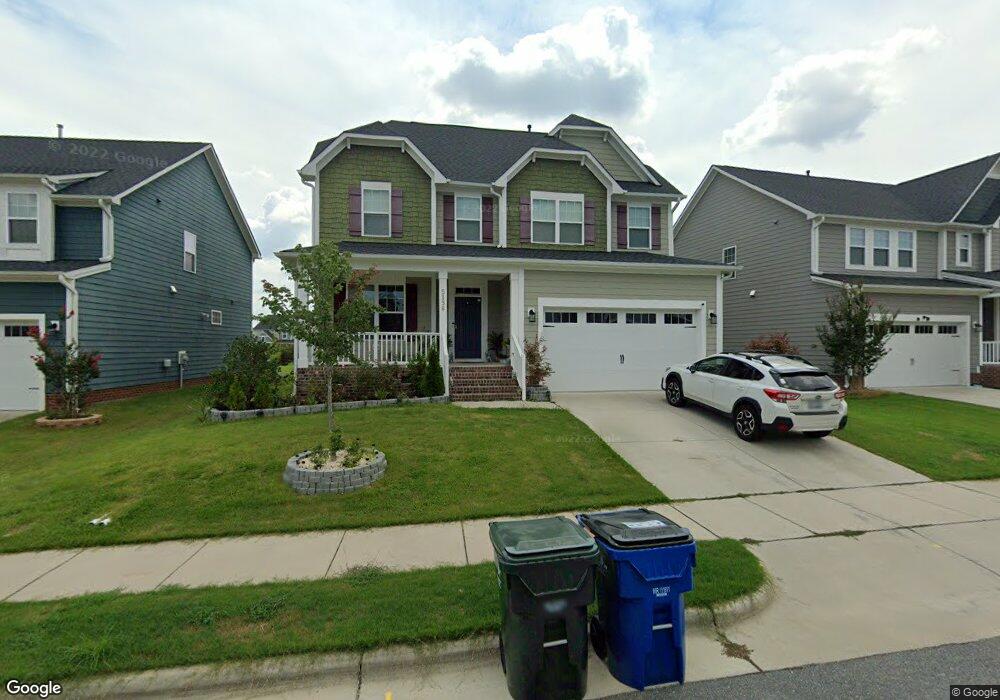
5136 Windmere Chase Dr Unit Lot 122 Raleigh, NC 27616
Northeast Raleigh NeighborhoodEstimated Value: $545,000 - $568,000
4
Beds
3
Baths
2,622
Sq Ft
$212/Sq Ft
Est. Value
About This Home
This home is located at 5136 Windmere Chase Dr Unit Lot 122, Raleigh, NC 27616 and is currently estimated at $555,566, approximately $211 per square foot. 5136 Windmere Chase Dr Unit Lot 122 is a home located in Wake County with nearby schools including Beaverdam Elementary School, River Bend Middle, and Rolesville High School.
Ownership History
Date
Name
Owned For
Owner Type
Purchase Details
Closed on
Feb 14, 2024
Sold by
Phiansin Chanthaphy and Wine Phu
Bought by
Huynh Chi Trung Vu and Le Khaai Thuy
Current Estimated Value
Home Financials for this Owner
Home Financials are based on the most recent Mortgage that was taken out on this home.
Original Mortgage
$444,000
Outstanding Balance
$436,168
Interest Rate
6.62%
Mortgage Type
New Conventional
Estimated Equity
$119,398
Purchase Details
Closed on
Nov 20, 2017
Sold by
M I Hoems Of Raleigh Llc
Bought by
Phiansin Chanthaphy and Pwint Phiansin Wine Phu
Home Financials for this Owner
Home Financials are based on the most recent Mortgage that was taken out on this home.
Original Mortgage
$293,390
Interest Rate
3.85%
Mortgage Type
New Conventional
Create a Home Valuation Report for This Property
The Home Valuation Report is an in-depth analysis detailing your home's value as well as a comparison with similar homes in the area
Home Values in the Area
Average Home Value in this Area
Purchase History
| Date | Buyer | Sale Price | Title Company |
|---|---|---|---|
| Huynh Chi Trung Vu | $555,000 | None Listed On Document | |
| Phiansin Chanthaphy | $326,000 | None Available |
Source: Public Records
Mortgage History
| Date | Status | Borrower | Loan Amount |
|---|---|---|---|
| Open | Huynh Chi Trung Vu | $444,000 | |
| Previous Owner | Phiansin Chanthaphy | $293,390 |
Source: Public Records
Tax History Compared to Growth
Tax History
| Year | Tax Paid | Tax Assessment Tax Assessment Total Assessment is a certain percentage of the fair market value that is determined by local assessors to be the total taxable value of land and additions on the property. | Land | Improvement |
|---|---|---|---|---|
| 2025 | $4,773 | $545,021 | $110,000 | $435,021 |
| 2024 | $4,754 | $545,021 | $110,000 | $435,021 |
| 2023 | $3,977 | $362,993 | $70,000 | $292,993 |
| 2022 | $3,695 | $362,993 | $70,000 | $292,993 |
| 2021 | $3,552 | $362,993 | $70,000 | $292,993 |
| 2020 | $3,487 | $362,993 | $70,000 | $292,993 |
| 2019 | $3,199 | $274,272 | $55,000 | $219,272 |
| 2018 | $3,017 | $274,272 | $55,000 | $219,272 |
| 2017 | $572 | $55,000 | $55,000 | $0 |
Source: Public Records
Map
Nearby Homes
- 5208 Windmere Chase Dr
- 4416 Brintons Cottage St
- 4508 Brintons Cottage St
- 4821 Heathshire Dr
- 4236 Saubranch Hill St
- 4416 Walker Hallow St
- 4809 Kaycee Ct
- 4139 Davis Meadow St
- 4252 Rockdell Hall St
- 4348 Karlbrook Ln
- 4809 Elmhurst Ridge Ct
- 4800 Arbor Lodge Dr
- 4440 Cardinal Grove Blvd
- 4809 Arbor Chase Dr
- 4416 Major Loring Way
- 5325 Marthonna Way
- 5525 Buffaloe Rd
- 4500 Rivershyre Way
- 5012 Silverdene St
- 4604 Treadstone Ct
- 5136 Windmere Chase Dr
- 5132 Windmere Chase Dr Unit Lot 123
- 5140 Windmere Chase Dr
- 5128 Windmere Chase Dr Unit Lot 124
- 4417 Brintons Cottage St Unit Lot 119
- 4421 Brintons Cottage St
- 4801 Heathshire Dr
- 4413 Brintons Cottage St Unit Lot 118
- 4413 Brintons Cottage St
- 5124 Windmere Chase Dr Unit Lot 125
- 5200 Windmere Chase Dr
- 5133 Windmere Chase Dr Unit Lot 168
- 5137 Windmere Chase Dr Unit Lot 169
- 5137 Windmere Chase Dr
- 4409 Brintons Cottage St Unit Lot 117
- 5125 Windmere Chase Dr
- 5129 Windmere Chase Dr Unit Lot 167
- 4805 Heathshire Dr
- 5120 Windmere Chase Dr Unit Lot 126
- 5201 Windmere Chase Dr