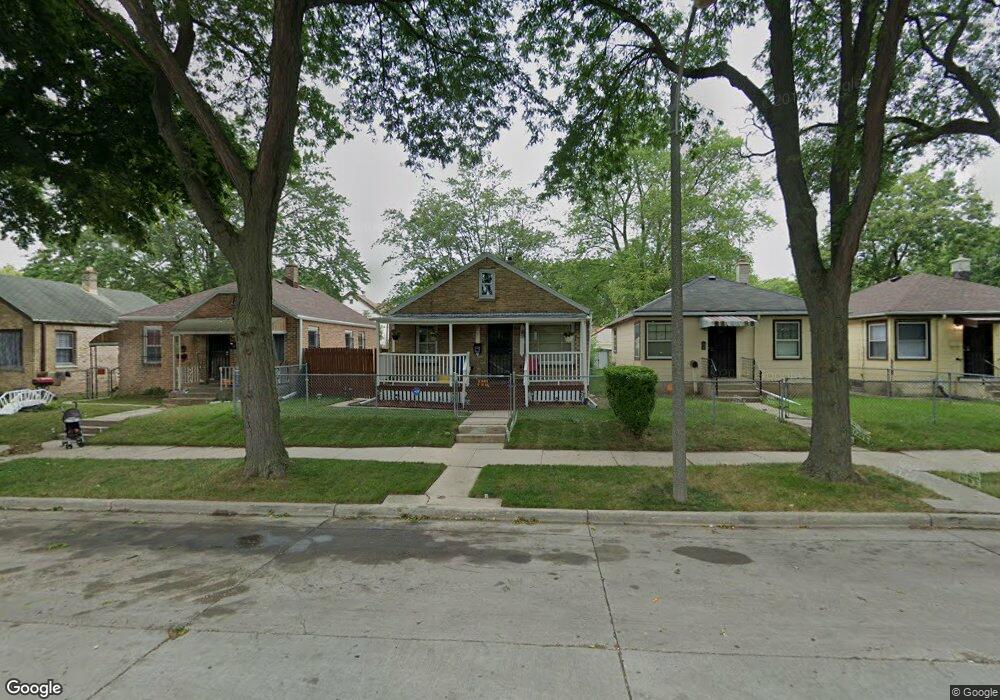
5139 N 38th St Milwaukee, WI 53209
Old North Milwaukee NeighborhoodEstimated Value: $92,000 - $105,747
2
Beds
1
Bath
744
Sq Ft
$136/Sq Ft
Est. Value
About This Home
This home is located at 5139 N 38th St, Milwaukee, WI 53209 and is currently estimated at $101,187, approximately $136 per square foot. 5139 N 38th St is a home located in Milwaukee County with nearby schools including Craig Montessori School, La Escuela Fratney, and Milwaukee German Immersion School.
Ownership History
Date
Name
Owned For
Owner Type
Purchase Details
Closed on
Feb 14, 2012
Sold by
Starks Mary L
Bought by
Starks Tramell E
Current Estimated Value
Purchase Details
Closed on
Aug 21, 2002
Sold by
Bank Of New York
Bought by
Starks Mary L
Purchase Details
Closed on
Apr 15, 2002
Sold by
Murray Charles M
Bought by
Bank Of New York
Purchase Details
Closed on
Oct 20, 1999
Sold by
Merem Rehab Inc
Bought by
Murray Charles M
Home Financials for this Owner
Home Financials are based on the most recent Mortgage that was taken out on this home.
Original Mortgage
$38,400
Interest Rate
7.9%
Mortgage Type
Seller Take Back
Purchase Details
Closed on
Oct 14, 1999
Sold by
Brunner Todd
Bought by
Merem Rehab Inc
Home Financials for this Owner
Home Financials are based on the most recent Mortgage that was taken out on this home.
Original Mortgage
$38,400
Interest Rate
7.9%
Mortgage Type
Seller Take Back
Create a Home Valuation Report for This Property
The Home Valuation Report is an in-depth analysis detailing your home's value as well as a comparison with similar homes in the area
Home Values in the Area
Average Home Value in this Area
Purchase History
| Date | Buyer | Sale Price | Title Company |
|---|---|---|---|
| Starks Tramell E | -- | None Available | |
| Starks Mary L | $31,100 | -- | |
| Bank Of New York | $34,000 | -- | |
| Murray Charles M | $48,000 | -- | |
| Merem Rehab Inc | $36,900 | -- |
Source: Public Records
Mortgage History
| Date | Status | Borrower | Loan Amount |
|---|---|---|---|
| Previous Owner | Murray Charles M | $38,400 | |
| Closed | Murray Charles M | $7,200 |
Source: Public Records
Tax History Compared to Growth
Tax History
| Year | Tax Paid | Tax Assessment Tax Assessment Total Assessment is a certain percentage of the fair market value that is determined by local assessors to be the total taxable value of land and additions on the property. | Land | Improvement |
|---|---|---|---|---|
| 2024 | $1,768 | $80,900 | $3,500 | $77,400 |
| 2023 | $1,701 | $72,000 | $3,500 | $68,500 |
| 2022 | $1,641 | $72,000 | $3,500 | $68,500 |
| 2021 | $995 | $40,500 | $3,500 | $37,000 |
| 2020 | $985 | $40,500 | $3,500 | $37,000 |
| 2019 | $969 | $38,900 | $3,400 | $35,500 |
| 2018 | $939 | $38,900 | $3,400 | $35,500 |
| 2017 | $1,045 | $41,000 | $4,900 | $36,100 |
| 2016 | $1,182 | $43,800 | $4,900 | $38,900 |
| 2015 | $1,205 | $43,800 | $4,900 | $38,900 |
| 2014 | $1,232 | $43,800 | $4,900 | $38,900 |
| 2013 | -- | $47,100 | $4,900 | $42,200 |
Source: Public Records
Map
Nearby Homes
- 5112 N 37th St
- 4010 W Villard Ave
- 5016 N Hopkins St
- 2530 W Villard Ave
- 3726 W Fairmount Ave
- 5277 N 38th St
- 4025 W Fairmount Ave
- 5326 N 38th St
- 5337 N 38th St
- 5312 N 36th St
- 4935 N 36th St
- 4877 N 40th St
- 5403 N 37th St
- 4855 N Hopkins St
- 5411 N 37th St
- 4863 N 40th St
- 4852 N 37th St
- 5324 N 34th St
- 3222 W Fairmount Ave
- 4836 N 40th St
- 5143 N 38th St
- 5133 N 38th St
- 5151 N 38th St
- 5129 N 38th St
- 5123 N 38th St
- 5119 N 38th St
- 5136 N 39th St
- 5140 N 39th St
- 5130 N 39th St
- 5146 N 39th St
- 5158 N 39th St
- 5113 N 38th St
- 5122 N 39th St
- 5150 N 39th St
- 5116 N 39th St Unit 5118
- 5109 N 38th St
- 5160 N 39th St
- 5103 N 38th St
- 5110 N 39th St
- 5166 N 39th St