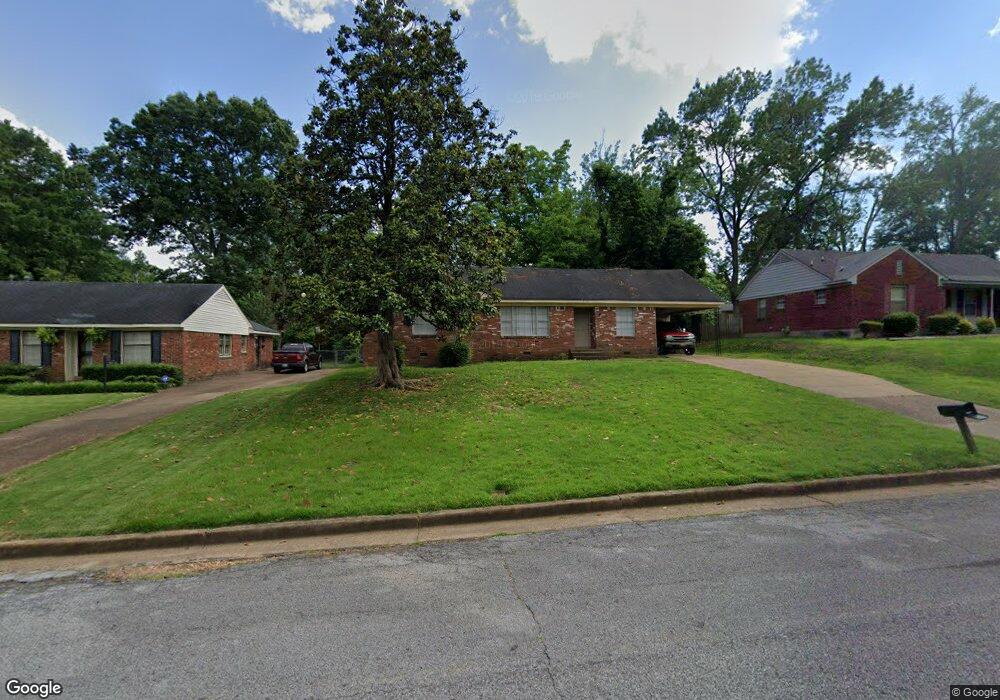
5139 Rolling Meadows Dr Memphis, TN 38134
Estimated Value: $193,404 - $207,000
3
Beds
2
Baths
1,614
Sq Ft
$124/Sq Ft
Est. Value
About This Home
This home is located at 5139 Rolling Meadows Dr, Memphis, TN 38134 and is currently estimated at $199,351, approximately $123 per square foot. 5139 Rolling Meadows Dr is a home located in Shelby County with nearby schools including Brownsville Rd Elementary School, Craigmont Middle School, and Craigmont High School.
Ownership History
Date
Name
Owned For
Owner Type
Purchase Details
Closed on
Mar 21, 2018
Sold by
Rolling Corbridge Llc
Bought by
Property Factor Aus Llc
Current Estimated Value
Purchase Details
Closed on
Jul 28, 2015
Sold by
Shelby Holdings Llc
Bought by
Rolling Corbridge Llc
Home Financials for this Owner
Home Financials are based on the most recent Mortgage that was taken out on this home.
Original Mortgage
$55,800
Interest Rate
4.11%
Mortgage Type
Purchase Money Mortgage
Purchase Details
Closed on
Mar 24, 2015
Sold by
Rinaldi Ronald George
Bought by
Shelby Holdings Llc
Home Financials for this Owner
Home Financials are based on the most recent Mortgage that was taken out on this home.
Original Mortgage
$56,289
Interest Rate
3.87%
Mortgage Type
Purchase Money Mortgage
Create a Home Valuation Report for This Property
The Home Valuation Report is an in-depth analysis detailing your home's value as well as a comparison with similar homes in the area
Home Values in the Area
Average Home Value in this Area
Purchase History
| Date | Buyer | Sale Price | Title Company |
|---|---|---|---|
| Property Factor Aus Llc | -- | None Available | |
| Rolling Corbridge Llc | $93,000 | Attorney | |
| Shelby Holdings Llc | $38,000 | None Available |
Source: Public Records
Mortgage History
| Date | Status | Borrower | Loan Amount |
|---|---|---|---|
| Previous Owner | Rolling Corbridge Llc | $55,800 | |
| Previous Owner | Shelby Holdings Llc | $56,289 |
Source: Public Records
Tax History
| Year | Tax Paid | Tax Assessment Tax Assessment Total Assessment is a certain percentage of the fair market value that is determined by local assessors to be the total taxable value of land and additions on the property. | Land | Improvement |
|---|---|---|---|---|
| 2025 | $1,087 | $42,950 | $5,000 | $37,950 |
| 2024 | $1,087 | $32,075 | $3,875 | $28,200 |
| 2023 | $1,954 | $32,075 | $3,875 | $28,200 |
| 2022 | $1,954 | $32,075 | $3,875 | $28,200 |
| 2021 | $1,977 | $32,075 | $3,875 | $28,200 |
| 2020 | $1,487 | $20,525 | $3,875 | $16,650 |
| 2019 | $656 | $20,525 | $3,875 | $16,650 |
| 2018 | $656 | $20,525 | $3,875 | $16,650 |
| 2017 | $671 | $20,525 | $3,875 | $16,650 |
| 2016 | $851 | $19,475 | $0 | $0 |
| 2014 | $851 | $19,475 | $0 | $0 |
Source: Public Records
Map
Nearby Homes
- 3294 Gatewood Dr
- 5136 Rolling Fields Dr
- 5167 Rolling Fields Dr
- 5139 Steuben Dr
- 3263 Glen Logan Rd
- 3213 Covington Pike
- 3209 Canyon Rd
- 3507 Chowning Rd
- 3496 Lynchburg St
- 5366 Craigmont Dr
- 5315 Yale Rd
- 3589 Covington Pike Unit 214
- 3589 Covington Pike Unit 424
- 3589 Covington Pike Unit 216
- 3589 Covington Pike Unit 513
- 3589 Covington Pike Unit 222
- 3589 Covington Pike Unit 407
- 5013 Scheibler Rd Unit C1
- 4851 Rolling Meadows Dr
- 3442 Wythe Rd
- 5145 Rolling Meadows Dr
- 5131 Rolling Meadows Dr
- 5140 Craigmont Dr
- 5153 Rolling Meadows Dr
- 5123 Rolling Meadows Dr
- 5146 Craigmont Dr
- 5132 Craigmont Dr
- 5140 Rolling Meadows Dr
- 5132 Rolling Meadows Dr
- 5154 Craigmont Dr
- 5146 Rolling Meadows Dr
- 5124 Craigmont Dr
- 5159 Rolling Meadows Dr
- 5115 Rolling Meadows Dr
- 5124 Rolling Meadows Dr
- 5154 Rolling Meadows Dr
- 5116 Craigmont Dr
- 5160 Craigmont Dr
- 5160 Rolling Meadows Dr
- 5116 Rolling Meadows Dr
Your Personal Tour Guide
Ask me questions while you tour the home.