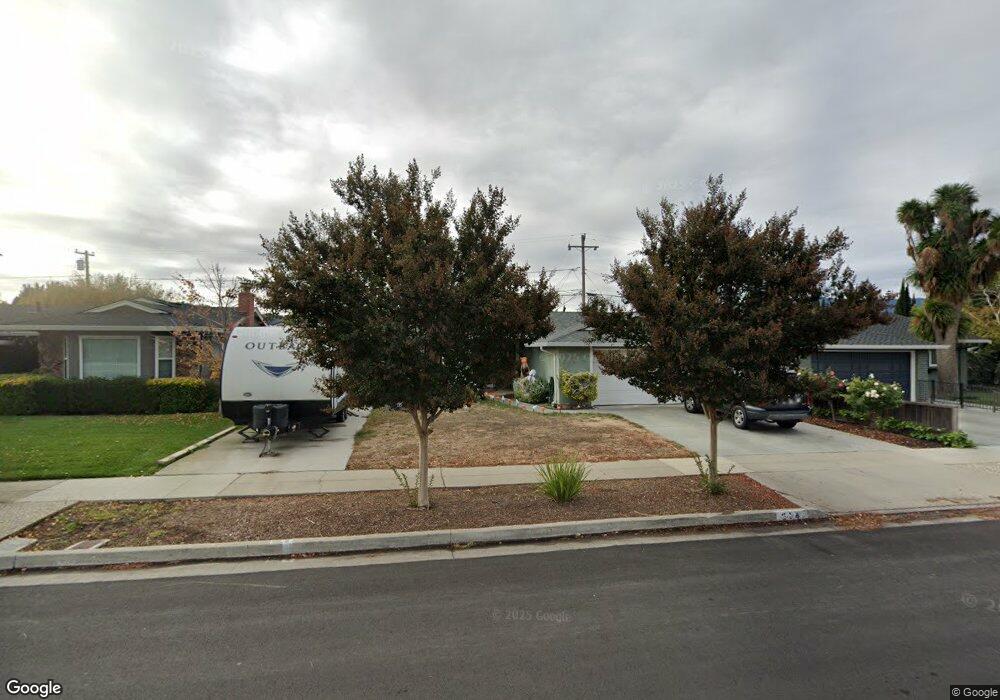
514 Cheyenne Ln San Jose, CA 95123
Comanche NeighborhoodEstimated Value: $1,273,712 - $1,413,000
4
Beds
2
Baths
1,345
Sq Ft
$1,009/Sq Ft
Est. Value
About This Home
This home is located at 514 Cheyenne Ln, San Jose, CA 95123 and is currently estimated at $1,357,428, approximately $1,009 per square foot. 514 Cheyenne Ln is a home located in Santa Clara County with nearby schools including Frost (Earl) Elementary School, Herman (Leonard) Intermediate School, and Santa Teresa High School.
Ownership History
Date
Name
Owned For
Owner Type
Purchase Details
Closed on
Oct 1, 2014
Sold by
Velasquez Carlos and Velasquez Alberta
Bought by
The Velasquez Family and Velasquez Alberta D
Current Estimated Value
Purchase Details
Closed on
Jan 19, 2011
Sold by
Rodriguez Jesus and Rodriguez Justina
Bought by
Velasquez Carlos and Velasquez Alberta
Purchase Details
Closed on
Jul 20, 2004
Sold by
Owen Shirley A
Bought by
Rodriguez Jesus and Rodriguez Justina
Home Financials for this Owner
Home Financials are based on the most recent Mortgage that was taken out on this home.
Original Mortgage
$420,800
Interest Rate
3.11%
Mortgage Type
Purchase Money Mortgage
Purchase Details
Closed on
Oct 30, 2003
Sold by
Owen Shirley A
Bought by
Owen Shirley A
Purchase Details
Closed on
May 29, 2002
Sold by
Owen Thomas L
Bought by
Owen Shirley A
Home Financials for this Owner
Home Financials are based on the most recent Mortgage that was taken out on this home.
Original Mortgage
$147,500
Interest Rate
6.74%
Create a Home Valuation Report for This Property
The Home Valuation Report is an in-depth analysis detailing your home's value as well as a comparison with similar homes in the area
Home Values in the Area
Average Home Value in this Area
Purchase History
| Date | Buyer | Sale Price | Title Company |
|---|---|---|---|
| The Velasquez Family | -- | None Available | |
| Velasquez Carlos | $400,000 | Old Republic Title Company | |
| Rodriguez Jesus | $526,000 | Alliance Title Company | |
| Owen Shirley A | -- | -- | |
| Owen Shirley A | -- | -- |
Source: Public Records
Mortgage History
| Date | Status | Borrower | Loan Amount |
|---|---|---|---|
| Previous Owner | Rodriguez Jesus | $420,800 | |
| Previous Owner | Owen Shirley A | $147,500 | |
| Closed | Rodriguez Jesus | $105,200 |
Source: Public Records
Tax History Compared to Growth
Tax History
| Year | Tax Paid | Tax Assessment Tax Assessment Total Assessment is a certain percentage of the fair market value that is determined by local assessors to be the total taxable value of land and additions on the property. | Land | Improvement |
|---|---|---|---|---|
| 2025 | $7,375 | $477,288 | $345,408 | $131,880 |
| 2024 | $7,375 | $467,931 | $338,636 | $129,295 |
| 2023 | $7,240 | $458,757 | $331,997 | $126,760 |
| 2022 | $7,195 | $449,763 | $325,488 | $124,275 |
| 2021 | $7,061 | $440,945 | $319,106 | $121,839 |
| 2020 | $6,885 | $436,424 | $315,834 | $120,590 |
| 2019 | $6,716 | $427,868 | $309,642 | $118,226 |
| 2018 | $6,659 | $419,479 | $303,571 | $115,908 |
| 2017 | $6,566 | $411,255 | $297,619 | $113,636 |
| 2016 | $6,250 | $403,192 | $291,784 | $111,408 |
| 2015 | $6,108 | $397,137 | $287,402 | $109,735 |
| 2014 | $5,484 | $389,359 | $281,773 | $107,586 |
Source: Public Records
Map
Nearby Homes
- 5756 Pontiac Dr
- 521 Canton Dr
- 5806 Blossom Ave
- 5841 Blossom Ave
- 404 Ariel Dr
- 729 Calero Ave
- 5967 Shawcroft Dr
- 625 Kiowa Cir
- 5850 Chesbro Ave
- 5780 Herma St
- 405 Don Carlos Ct
- 5697 Chesbro Ave
- 379 Roan St
- 5631 Herma St
- 5991 Sorrel Ave
- 5459 Entrada Cedros
- 310 Tradewinds Dr Unit 8
- 5558 Judith St Unit 1
- 341 Blossom Hill Rd Unit 3
- 469 Velasco Dr
- 512 Cheyenne Ln
- 520 Cheyenne Ln
- 525 Paiute Ln
- 521 Paiute Ln
- 527 Paiute Ln
- 506 Cheyenne Ln
- 519 Paiute Ln
- 509 Cheyenne Ln
- 513 Cheyenne Ln
- 507 Cheyenne Ln
- 502 Cheyenne Ln
- 515 Cheyenne Ln
- 523 Cheyenne Ln
- 521 Cheyenne Ln
- 503 Cheyenne Ln
- 515 Paiute Ln
- 525 Cheyenne Ln
- 519 Cheyenne Ln
- 517 Cheyenne Ln
- 498 Cheyenne Ln