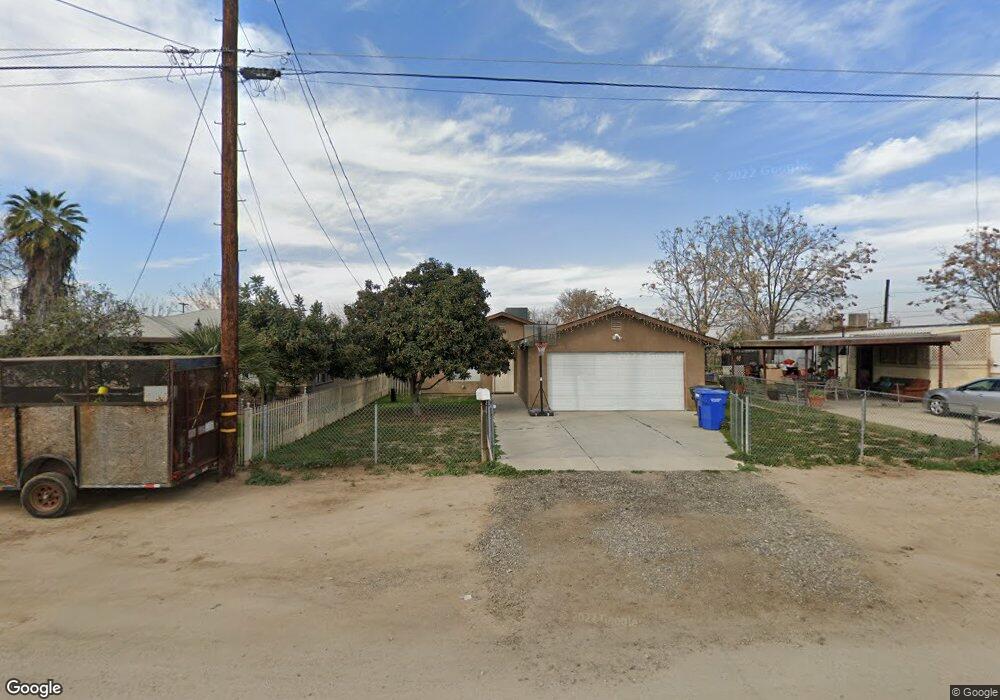
514 Gibson Ln Shafter, CA 93263
Estimated Value: $221,000 - $297,351
3
Beds
1
Bath
1,168
Sq Ft
$227/Sq Ft
Est. Value
About This Home
This home is located at 514 Gibson Ln, Shafter, CA 93263 and is currently estimated at $265,338, approximately $227 per square foot. 514 Gibson Ln is a home located in Kern County with nearby schools including Redwood Elementary School, Golden Oak Elementary School, and Shafter High School.
Ownership History
Date
Name
Owned For
Owner Type
Purchase Details
Closed on
Nov 8, 2019
Sold by
Ebling Lillian
Bought by
Ebling Jim
Current Estimated Value
Purchase Details
Closed on
Feb 25, 2010
Sold by
Robles Fortunato
Bought by
Ebling Jim
Purchase Details
Closed on
Oct 10, 2006
Sold by
Robles Francisco and Robles Maria
Bought by
Robles Fortunato
Purchase Details
Closed on
Aug 4, 2004
Sold by
Ashbrooks Billy Gene
Bought by
Robles Francisco and Robles Maria
Purchase Details
Closed on
Jun 11, 1996
Sold by
Ashbrooks Florence I W and Ashbrooks George W
Bought by
Ashbrooks Billy Jean
Purchase Details
Closed on
Feb 29, 1996
Sold by
Ashbrooks George W and Ashbrooks Florence I
Bought by
Ashbrooks Billy Jean
Purchase Details
Closed on
Sep 11, 1995
Sold by
Ashbrooks George W and Ashbrooks Florence I
Bought by
Ashbrooks George W and Ashbrooks Florence I
Create a Home Valuation Report for This Property
The Home Valuation Report is an in-depth analysis detailing your home's value as well as a comparison with similar homes in the area
Home Values in the Area
Average Home Value in this Area
Purchase History
| Date | Buyer | Sale Price | Title Company |
|---|---|---|---|
| Ebling Jim | -- | None Available | |
| Ebling Jim | $55,609 | None Available | |
| Robles Fortunato | -- | None Available | |
| Robles Francisco | $2,000 | -- | |
| Ashbrooks Billy Jean | -- | -- | |
| Ashbrooks Billy Jean | -- | -- | |
| Ashbrooks George W | -- | -- |
Source: Public Records
Tax History
| Year | Tax Paid | Tax Assessment Tax Assessment Total Assessment is a certain percentage of the fair market value that is determined by local assessors to be the total taxable value of land and additions on the property. | Land | Improvement |
|---|---|---|---|---|
| 2025 | $1,557 | $105,834 | $25,809 | $80,025 |
| 2024 | $1,509 | $103,759 | $25,303 | $78,456 |
| 2023 | $1,509 | $101,725 | $24,807 | $76,918 |
| 2022 | $1,446 | $99,731 | $24,321 | $75,410 |
| 2021 | $1,383 | $97,777 | $23,845 | $73,932 |
| 2020 | $1,341 | $96,775 | $23,601 | $73,174 |
| 2019 | $1,338 | $96,775 | $23,601 | $73,174 |
| 2018 | $1,291 | $93,020 | $22,686 | $70,334 |
| 2017 | $1,283 | $91,197 | $22,242 | $68,955 |
| 2016 | $1,220 | $89,409 | $21,806 | $67,603 |
| 2015 | $1,188 | $88,067 | $21,479 | $66,588 |
| 2014 | $1,146 | $86,343 | $21,059 | $65,284 |
Source: Public Records
Map
Nearby Homes
- 509 Prince Ln
- 8736 Sagebrush Ave
- 8743 Sagebrush Ave
- 618 Sammy Way
- 708 Sammy Way
- 720 Sammy Way
- 728 Sammy Way
- 626 Sammy Way
- 716 Sammy Way
- 617 Sammy Way
- 625 Sammy Way
- 707 Sammy Way
- 732 Sammy Way
- 715 Sammy Way
- 613 Lawford St
- 605 Lawford St
- 421 Chris Ave
- 4016 Green Way
- 8728 Brindlewood Ave
- 8724 Brindlewood Ave
Your Personal Tour Guide
Ask me questions while you tour the home.