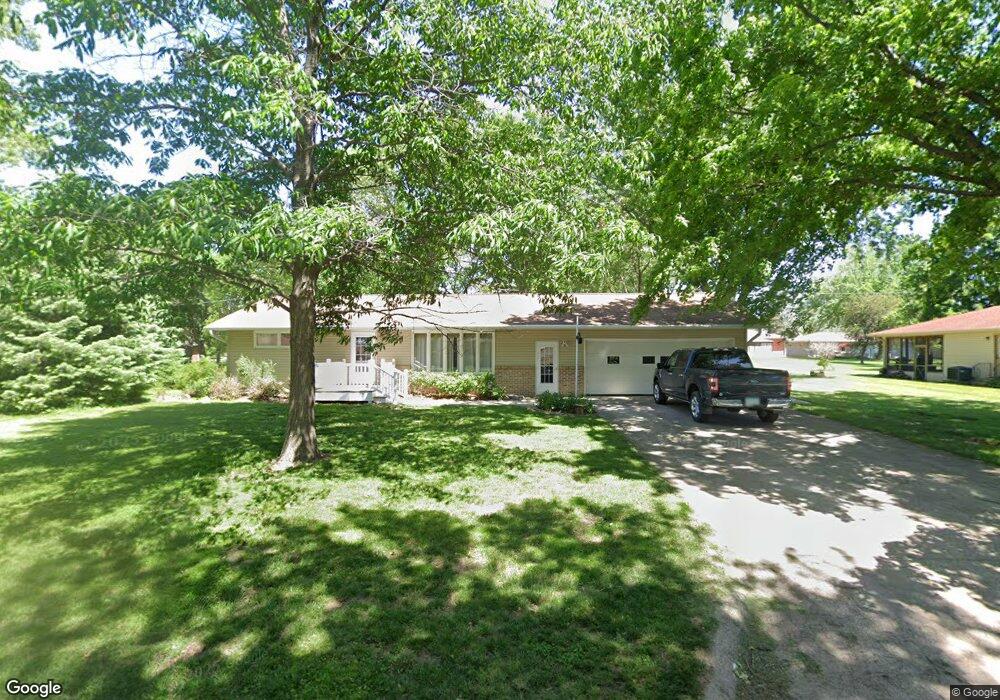
514 Liston St Danbury, IA 51019
Estimated Value: $133,000 - $219,000
3
Beds
3
Baths
1,302
Sq Ft
$126/Sq Ft
Est. Value
About This Home
This home is located at 514 Liston St, Danbury, IA 51019 and is currently estimated at $163,764, approximately $125 per square foot. 514 Liston St is a home located in Woodbury County with nearby schools including Mapleton Elementary School, Mvao Middle School, and Maple Valley-Anthon Oto High School.
Ownership History
Date
Name
Owned For
Owner Type
Purchase Details
Closed on
May 21, 2019
Sold by
Burton Bruce A and Burton Carol J
Bought by
Maynard Cody W
Current Estimated Value
Home Financials for this Owner
Home Financials are based on the most recent Mortgage that was taken out on this home.
Original Mortgage
$118,750
Outstanding Balance
$104,193
Interest Rate
4.1%
Mortgage Type
New Conventional
Estimated Equity
$59,571
Purchase Details
Closed on
Mar 16, 2017
Sold by
Mohrhaauser Robert G and Mohrhauser Faye E
Bought by
Burton Bruce A and Burton Carol J
Create a Home Valuation Report for This Property
The Home Valuation Report is an in-depth analysis detailing your home's value as well as a comparison with similar homes in the area
Home Values in the Area
Average Home Value in this Area
Purchase History
| Date | Buyer | Sale Price | Title Company |
|---|---|---|---|
| Maynard Cody W | $125,000 | -- | |
| Burton Bruce A | $137,500 | None Available |
Source: Public Records
Mortgage History
| Date | Status | Borrower | Loan Amount |
|---|---|---|---|
| Open | Maynard Cody W | $118,750 |
Source: Public Records
Tax History Compared to Growth
Tax History
| Year | Tax Paid | Tax Assessment Tax Assessment Total Assessment is a certain percentage of the fair market value that is determined by local assessors to be the total taxable value of land and additions on the property. | Land | Improvement |
|---|---|---|---|---|
| 2025 | $1,416 | $107,500 | $12,140 | $95,360 |
| 2024 | $1,416 | $103,840 | $12,140 | $91,700 |
| 2023 | $1,406 | $103,840 | $12,140 | $91,700 |
| 2022 | $1,310 | $93,550 | $12,140 | $81,410 |
| 2021 | $1,310 | $93,550 | $12,140 | $81,410 |
| 2020 | $1,496 | $97,950 | $12,990 | $84,960 |
| 2019 | $1,508 | $97,950 | $12,990 | $84,960 |
| 2018 | $1,480 | $97,950 | $12,990 | $84,960 |
| 2017 | $1,480 | $97,950 | $12,990 | $84,960 |
| 2016 | $1,330 | $97,950 | $0 | $0 |
| 2015 | $1,363 | $91,540 | $12,140 | $79,400 |
| 2014 | $1,345 | $91,540 | $12,140 | $79,400 |
Source: Public Records
Map
Nearby Homes