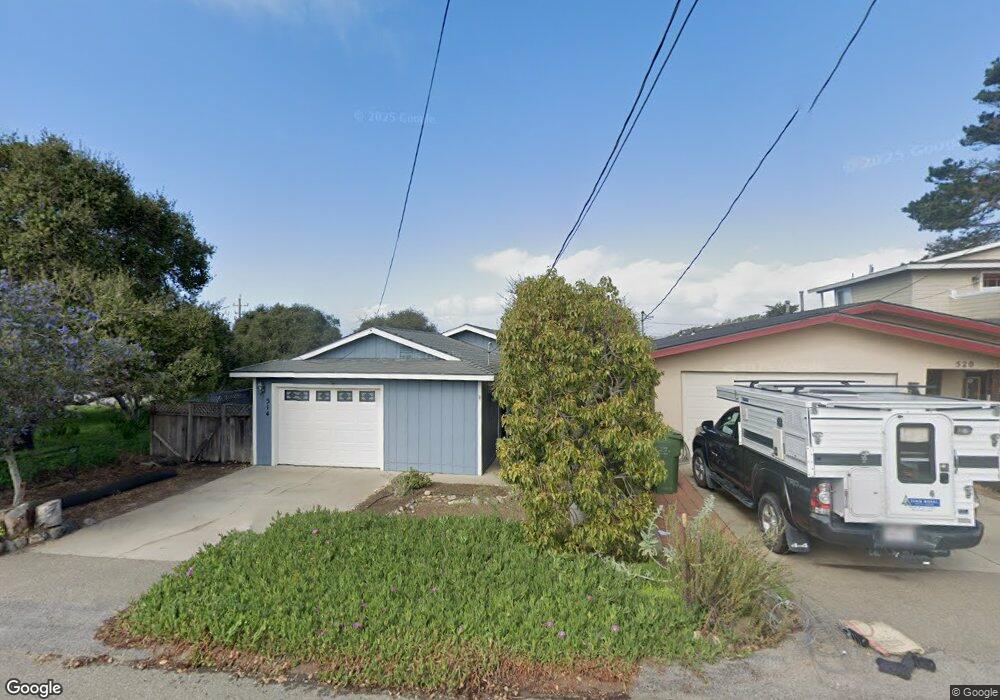
514 Loma St Los Osos, CA 93402
Estimated Value: $742,698 - $841,000
2
Beds
2
Baths
1,378
Sq Ft
$579/Sq Ft
Est. Value
About This Home
This home is located at 514 Loma St, Los Osos, CA 93402 and is currently estimated at $797,175, approximately $578 per square foot. 514 Loma St is a home located in San Luis Obispo County with nearby schools including Monarch Grove Elementary School, Los Osos Middle School, and Morro Bay High School.
Ownership History
Date
Name
Owned For
Owner Type
Purchase Details
Closed on
Jun 2, 2010
Sold by
Cruttenden Robert S and Cruttenden Elizabeth A
Bought by
Burke Kena C
Current Estimated Value
Home Financials for this Owner
Home Financials are based on the most recent Mortgage that was taken out on this home.
Original Mortgage
$325,615
Outstanding Balance
$217,154
Interest Rate
4.87%
Mortgage Type
FHA
Estimated Equity
$580,021
Purchase Details
Closed on
Nov 17, 2003
Sold by
Cruttenden Robert S and The Cruttenden Family Trust
Bought by
Cruttenden Robert S and Cruttenden Elizabeth A
Create a Home Valuation Report for This Property
The Home Valuation Report is an in-depth analysis detailing your home's value as well as a comparison with similar homes in the area
Home Values in the Area
Average Home Value in this Area
Purchase History
| Date | Buyer | Sale Price | Title Company |
|---|---|---|---|
| Burke Kena C | $330,000 | Fidelity National Title Co | |
| Cruttenden Robert S | -- | -- |
Source: Public Records
Mortgage History
| Date | Status | Borrower | Loan Amount |
|---|---|---|---|
| Open | Burke Kena C | $325,615 |
Source: Public Records
Tax History Compared to Growth
Tax History
| Year | Tax Paid | Tax Assessment Tax Assessment Total Assessment is a certain percentage of the fair market value that is determined by local assessors to be the total taxable value of land and additions on the property. | Land | Improvement |
|---|---|---|---|---|
| 2025 | $7,217 | $425,958 | $212,979 | $212,979 |
| 2024 | $7,141 | $417,606 | $208,803 | $208,803 |
| 2023 | $7,141 | $409,418 | $204,709 | $204,709 |
| 2022 | $6,606 | $401,392 | $200,696 | $200,696 |
| 2021 | $6,478 | $393,522 | $196,761 | $196,761 |
| 2020 | $6,369 | $389,488 | $194,744 | $194,744 |
| 2019 | $6,051 | $381,852 | $190,926 | $190,926 |
| 2018 | $6,057 | $374,366 | $187,183 | $187,183 |
| 2017 | $6,594 | $367,026 | $183,513 | $183,513 |
| 2016 | $4,673 | $359,830 | $179,915 | $179,915 |
| 2015 | $4,612 | $354,426 | $177,213 | $177,213 |
| 2014 | $4,298 | $347,484 | $173,742 | $173,742 |
Source: Public Records
Map
Nearby Homes