Estimated Value: $577,986 - $634,000
--
Bed
1
Bath
2,736
Sq Ft
$217/Sq Ft
Est. Value
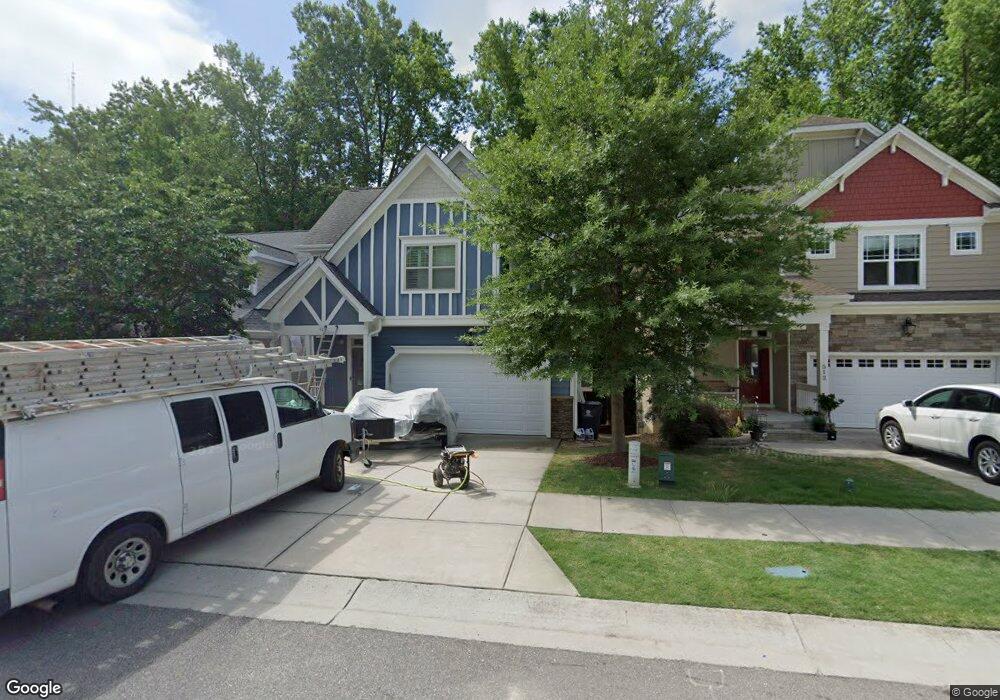
About This Home
This home is located at 514 Mill Hopper Ln Unit 22, Apex, NC 27502 and is currently estimated at $592,497, approximately $216 per square foot. 514 Mill Hopper Ln Unit 22 is a home located in Wake County with nearby schools including Apex Elementary School, Apex Middle, and Apex High School.
Ownership History
Date
Name
Owned For
Owner Type
Purchase Details
Closed on
Jul 18, 2014
Sold by
Makers Terry Lynn
Bought by
Locklear Bonnie Rae
Current Estimated Value
Purchase Details
Closed on
Jan 28, 2014
Sold by
Stancil Builders Inc
Bought by
Locklear Bonnie Rae and Makers Terry Lynn
Home Financials for this Owner
Home Financials are based on the most recent Mortgage that was taken out on this home.
Original Mortgage
$264,095
Interest Rate
4.48%
Mortgage Type
New Conventional
Purchase Details
Closed on
Apr 1, 2013
Sold by
Bridges Ulmer Za and Bridges Grace Bolles
Bought by
Stancil Builders Inc
Purchase Details
Closed on
Oct 23, 2007
Sold by
Horizon Homes Incorporated
Bought by
Bridges Ulmer Z and Bridges Grace Bolles
Create a Home Valuation Report for This Property
The Home Valuation Report is an in-depth analysis detailing your home's value as well as a comparison with similar homes in the area
Home Values in the Area
Average Home Value in this Area
Purchase History
| Date | Buyer | Sale Price | Title Company |
|---|---|---|---|
| Locklear Bonnie Rae | -- | None Available | |
| Locklear Bonnie Rae | $267,500 | None Available | |
| Stancil Builders Inc | $53,000 | None Available | |
| Bridges Ulmer Z | $97,200 | None Available |
Source: Public Records
Mortgage History
| Date | Status | Borrower | Loan Amount |
|---|---|---|---|
| Previous Owner | Locklear Bonnie Rae | $264,095 |
Source: Public Records
Tax History Compared to Growth
Tax History
| Year | Tax Paid | Tax Assessment Tax Assessment Total Assessment is a certain percentage of the fair market value that is determined by local assessors to be the total taxable value of land and additions on the property. | Land | Improvement |
|---|---|---|---|---|
| 2025 | $4,780 | $545,184 | $130,000 | $415,184 |
| 2024 | $4,673 | $545,184 | $130,000 | $415,184 |
| 2023 | $3,943 | $357,569 | $75,000 | $282,569 |
| 2022 | $3,701 | $357,569 | $75,000 | $282,569 |
| 2021 | $3,560 | $357,569 | $75,000 | $282,569 |
| 2020 | $3,524 | $357,569 | $75,000 | $282,569 |
| 2019 | $3,760 | $329,319 | $60,000 | $269,319 |
| 2018 | $3,542 | $329,319 | $60,000 | $269,319 |
| 2017 | $3,297 | $329,319 | $60,000 | $269,319 |
| 2016 | $2,925 | $296,230 | $60,000 | $236,230 |
| 2015 | -- | $250,633 | $63,000 | $187,633 |
| 2014 | -- | $63,000 | $63,000 | $0 |
Source: Public Records
Map
Nearby Homes
- 635 Sawcut Ln
- 631 Sawcut Ln
- 633 Sawcut Ln
- 547 Grand Central Station
- 596 Grand Central Station
- 1000 Oakgate Ct
- 311 Culvert St
- 309 Culvert St
- 105 Cunningham St
- 903 Norwood Ln
- 295 Williams Grove Ln Unit Lot 67
- 285 Williams Grove Ln Unit Lot 65
- 281 Williams Grove Ln Unit Lot 64
- 281 Williams Grove Ln
- 4006 New Yarmouth Way
- 273 Williams Grove Ln Unit Lot 62
- 265 Williams Grove Ln
- 298 Williams Grove Ln N Unit 68
- 294 Williams Grove Ln Unit 69
- 294 Williams Grove Ln
- 514 Mill Hopper Ln
- 516 Mill Hopper Ln
- 512 Mill Hopper Ln Unit 21
- 518 Mill Hopper Ln
- 510 Mill Hopper Ln
- 510 Mill Hopper Ln Unit 20
- 520 Mill Hopper Ln
- 508 Mill Hopper Ln
- 508 Mill Hopper Ln Unit 19
- 515 Mill Hopper Ln
- 513 Mill Hopper Ln
- 517 Mill Hopper Ln
- 522 Mill Hopper Ln
- 506 Mill Hopper Ln Unit 18
- 506 Mill Hopper Ln
- 519 Mill Hopper Ln
- 519 Mill Hopper Ln
- 519 Mill Hopper Ln Unit 10R
- 524 Mill Hopper Ln
- 504 Mill Hopper Ln