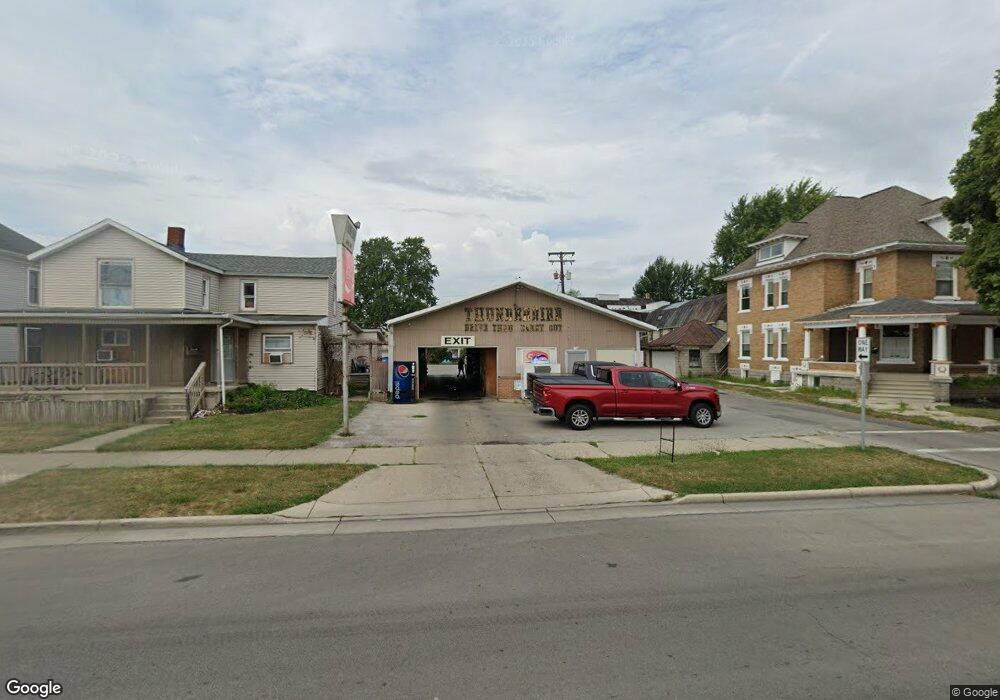
514 N Main St Findlay, OH 45840
Estimated Value: $243,486
Studio
--
Bath
2,736
Sq Ft
$89/Sq Ft
Est. Value
About This Home
This home is located at 514 N Main St, Findlay, OH 45840 and is currently estimated at $243,486, approximately $88 per square foot. 514 N Main St is a home located in Hancock County with nearby schools including Whittier Primary School, Bigelow Hill Elementary School, and Glenwood Middle School.
Ownership History
Date
Name
Owned For
Owner Type
Purchase Details
Closed on
Feb 11, 2022
Sold by
Henry Martinez Paul
Bought by
Cap Brothers Llc
Current Estimated Value
Purchase Details
Closed on
Aug 1, 2017
Sold by
Richard J Defend Llc
Bought by
Martinez Paul Henry and Cox Calvin Eugene
Home Financials for this Owner
Home Financials are based on the most recent Mortgage that was taken out on this home.
Original Mortgage
$150,000
Interest Rate
3.78%
Mortgage Type
Purchase Money Mortgage
Purchase Details
Closed on
Mar 29, 2013
Sold by
Kujawa Darlene A
Bought by
Richard J Defend Llc
Purchase Details
Closed on
Aug 8, 1983
Bought by
Kujawa Richard W and Kujawa Darlene
Create a Home Valuation Report for This Property
The Home Valuation Report is an in-depth analysis detailing your home's value as well as a comparison with similar homes in the area
Home Values in the Area
Average Home Value in this Area
Purchase History
| Date | Buyer | Sale Price | Title Company |
|---|---|---|---|
| Cap Brothers Llc | -- | Whitman Title | |
| Martinez Paul Henry | $150,000 | None Available | |
| Richard J Defend Llc | $75,000 | Flag City Title Ag | |
| Kujawa Richard W | $175,000 | -- |
Source: Public Records
Mortgage History
| Date | Status | Borrower | Loan Amount |
|---|---|---|---|
| Previous Owner | Martinez Paul Henry | $150,000 |
Source: Public Records
Tax History
| Year | Tax Paid | Tax Assessment Tax Assessment Total Assessment is a certain percentage of the fair market value that is determined by local assessors to be the total taxable value of land and additions on the property. | Land | Improvement |
|---|---|---|---|---|
| 2024 | $1,785 | $30,490 | $16,610 | $13,880 |
| 2023 | $1,712 | $30,490 | $16,610 | $13,880 |
| 2022 | $1,703 | $30,490 | $16,610 | $13,880 |
| 2021 | $1,586 | $24,570 | $9,490 | $15,080 |
| 2020 | $1,587 | $24,570 | $9,490 | $15,080 |
| 2019 | $3,419 | $52,620 | $9,490 | $43,130 |
| 2018 | $3,451 | $52,620 | $9,490 | $43,130 |
| 2017 | $1,613 | $24,570 | $9,490 | $15,080 |
| 2016 | $1,628 | $24,570 | $9,490 | $15,080 |
| 2015 | $1,733 | $26,770 | $4,800 | $21,970 |
| 2014 | $1,739 | $26,770 | $4,800 | $21,970 |
| 2012 | $1,748 | $26,770 | $4,800 | $21,970 |
Source: Public Records
Map
Nearby Homes
- 125 Cherry St
- 706 N Cory St
- 213 Cherry St
- 204 Laquineo St
- 407 Washington St
- 523 Center St
- 206 Midland Ave
- 322 Midland Ave
- 301 Allen Ave
- 640 Center St
- 807 W Main Cross St
- 514 Liberty St
- 1005 Broad Ave
- 527 W Sandusky St
- 719 Davis St
- 145 Madison Ave
- 439 Carnahan Ave
- 705 Swing Ave
- 140 Monroe Ave
- 146 Clifton Ave
Your Personal Tour Guide
Ask me questions while you tour the home.