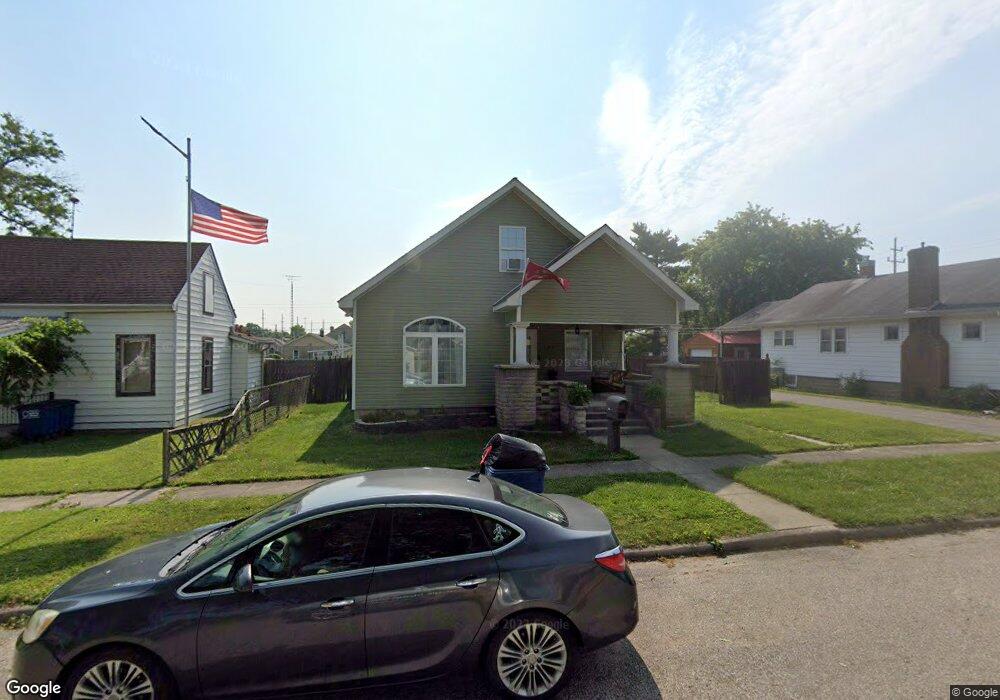
514 Q St Bedford, IN 47421
Estimated Value: $231,000 - $310,000
3
Beds
3
Baths
2,348
Sq Ft
$110/Sq Ft
Est. Value
About This Home
This home is located at 514 Q St, Bedford, IN 47421 and is currently estimated at $259,158, approximately $110 per square foot. 514 Q St is a home located in Lawrence County with nearby schools including Bedford North Lawrence High School, St. Vincent de Paul School, and Stone City Christian Academy.
Ownership History
Date
Name
Owned For
Owner Type
Purchase Details
Closed on
Apr 6, 2012
Sold by
Lewis Jordan
Bought by
Hendrix Jonathan M
Current Estimated Value
Home Financials for this Owner
Home Financials are based on the most recent Mortgage that was taken out on this home.
Original Mortgage
$129,730
Outstanding Balance
$89,564
Interest Rate
3.9%
Mortgage Type
VA
Estimated Equity
$169,594
Purchase Details
Closed on
Nov 25, 2008
Sold by
Craig Sheriff Sam
Bought by
Schickel Attorney Leslie W
Create a Home Valuation Report for This Property
The Home Valuation Report is an in-depth analysis detailing your home's value as well as a comparison with similar homes in the area
Home Values in the Area
Average Home Value in this Area
Purchase History
| Date | Buyer | Sale Price | Title Company |
|---|---|---|---|
| Hendrix Jonathan M | $127,000 | -- | |
| Hendrix Jonathan M | -- | -- | |
| Schickel Attorney Leslie W | $70,000 | Feiwell & Hannoy | |
| Attorney Leslie W Schickel | $70,000 | Feiwell & Hannoy |
Source: Public Records
Mortgage History
| Date | Status | Borrower | Loan Amount |
|---|---|---|---|
| Open | Hendrix Jonathan M | $129,730 |
Source: Public Records
Tax History Compared to Growth
Tax History
| Year | Tax Paid | Tax Assessment Tax Assessment Total Assessment is a certain percentage of the fair market value that is determined by local assessors to be the total taxable value of land and additions on the property. | Land | Improvement |
|---|---|---|---|---|
| 2024 | $1,900 | $190,000 | $12,000 | $178,000 |
| 2023 | $1,737 | $173,700 | $11,600 | $162,100 |
| 2022 | $1,629 | $162,900 | $11,200 | $151,700 |
| 2021 | $1,461 | $146,100 | $10,700 | $135,400 |
| 2020 | $1,379 | $137,900 | $10,200 | $127,700 |
| 2019 | $1,314 | $131,400 | $9,800 | $121,600 |
| 2018 | $1,289 | $128,900 | $9,600 | $119,300 |
| 2017 | $1,248 | $124,800 | $9,400 | $115,400 |
| 2016 | $1,238 | $123,800 | $9,400 | $114,400 |
| 2014 | $1,175 | $117,500 | $9,400 | $108,100 |
Source: Public Records
Map
Nearby Homes