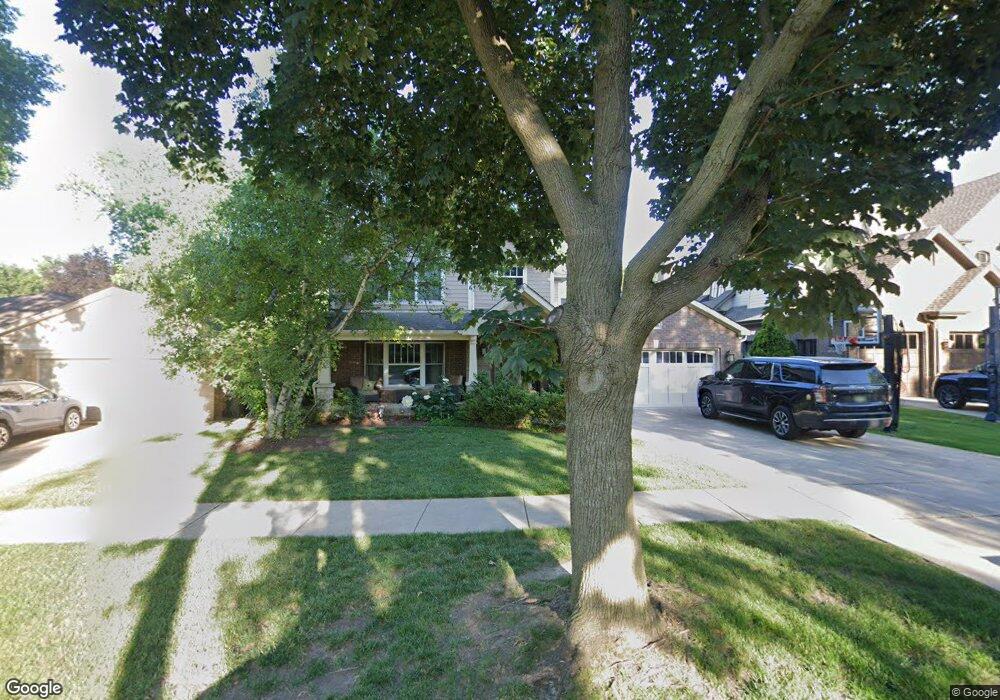
514 S Can Dota Ave Mount Prospect, IL 60056
Estimated Value: $724,000 - $857,000
4
Beds
3
Baths
3,116
Sq Ft
$249/Sq Ft
Est. Value
About This Home
This home is located at 514 S Can Dota Ave, Mount Prospect, IL 60056 and is currently estimated at $776,885, approximately $249 per square foot. 514 S Can Dota Ave is a home located in Cook County with nearby schools including Lions Park Elementary School, Lincoln Middle School, and Prospect High School.
Ownership History
Date
Name
Owned For
Owner Type
Purchase Details
Closed on
Jun 8, 2015
Sold by
Wolfe Craig and Wolfe Patricia
Bought by
Craig L Wolfe Trust
Current Estimated Value
Purchase Details
Closed on
Oct 18, 2011
Sold by
Stoebig Charles E and Wilson Stoebig Patricia
Bought by
Wolfe Craig and Wolfe Patricia
Purchase Details
Closed on
May 21, 2004
Sold by
Evans Susan S
Bought by
Stoebig Charles E and Wilson Stoebig Patricia
Home Financials for this Owner
Home Financials are based on the most recent Mortgage that was taken out on this home.
Original Mortgage
$316,000
Interest Rate
4.5%
Mortgage Type
Unknown
Purchase Details
Closed on
Jul 27, 2001
Sold by
Livingston Sue A
Bought by
Evans Susan S
Home Financials for this Owner
Home Financials are based on the most recent Mortgage that was taken out on this home.
Original Mortgage
$236,000
Interest Rate
7.14%
Purchase Details
Closed on
Jan 27, 1995
Sold by
Beicher Lois M
Bought by
Beicher Lois M
Create a Home Valuation Report for This Property
The Home Valuation Report is an in-depth analysis detailing your home's value as well as a comparison with similar homes in the area
Home Values in the Area
Average Home Value in this Area
Purchase History
| Date | Buyer | Sale Price | Title Company |
|---|---|---|---|
| Craig L Wolfe Trust | -- | None Available | |
| Wolfe Craig | $353,500 | None Available | |
| Stoebig Charles E | $395,000 | Atgf Inc | |
| Evans Susan S | $295,000 | -- | |
| Beicher Lois M | -- | -- |
Source: Public Records
Mortgage History
| Date | Status | Borrower | Loan Amount |
|---|---|---|---|
| Previous Owner | Stoebig Charles E | $316,000 | |
| Previous Owner | Evans Susan S | $236,000 | |
| Closed | Stoebig Charles E | $59,200 |
Source: Public Records
Tax History Compared to Growth
Tax History
| Year | Tax Paid | Tax Assessment Tax Assessment Total Assessment is a certain percentage of the fair market value that is determined by local assessors to be the total taxable value of land and additions on the property. | Land | Improvement |
|---|---|---|---|---|
| 2024 | $12,726 | $49,000 | $9,180 | $39,820 |
| 2023 | $12,208 | $49,000 | $9,180 | $39,820 |
| 2022 | $12,208 | $49,000 | $9,180 | $39,820 |
| 2021 | $8,571 | $30,838 | $5,967 | $24,871 |
| 2020 | $8,463 | $30,838 | $5,967 | $24,871 |
| 2019 | $8,457 | $34,265 | $5,967 | $28,298 |
| 2018 | $8,018 | $29,644 | $5,049 | $24,595 |
| 2017 | $8,058 | $29,644 | $5,049 | $24,595 |
| 2016 | $7,212 | $29,644 | $5,049 | $24,595 |
| 2015 | $7,224 | $27,476 | $4,131 | $23,345 |
| 2014 | $7,117 | $27,476 | $4,131 | $23,345 |
| 2013 | -- | $27,476 | $4,131 | $23,345 |
Source: Public Records
Map
Nearby Homes
- 522 W Council Trail
- 315 S We go Trail
- 437 S Elmhurst Rd
- 811 S Na wa ta Ave
- 901 S Can Dota Ave
- 400 S Wille St
- 909 S We go Trail
- 613 W Central Rd Unit B7
- 708 S Edgewood Ln
- 701 W Central Rd Unit B3
- 506 S Busse Rd
- 512 S Busse Rd
- 1200 W Palm Dr
- 905 W Palm Dr
- 207 E Berkshire Ln
- 1024 S Hunt Club Dr
- 5 S Pine St Unit 507B
- 5 S Pine St Unit 302B
- 904 S Edgewood Ln
- 10 S Wille St Unit 603
- 512 S Can Dota Ave
- 516 S Can Dota Ave
- 510 S Can Dota Ave
- 518 S Can Dota Ave
- 515 S Na wa ta Ave
- 511 S Na wa ta Ave
- 511 S Na wa ta Ave
- 517 S Na wa ta Ave
- 508 S Can Dota Ave
- 509 S Na wa ta Ave
- 519 S Na wa ta Ave
- 604 W Shabonee Trail
- 517 S Can Dota Ave
- 506 S Can Dota Ave
- 507 S Na wa ta Ave
- 600 S Can Dota Ave
- 513 S Can Dota Ave
- 513 S Can Dota Ave
- 601 S Can Dota Ave
- 504 S Can Dota Ave