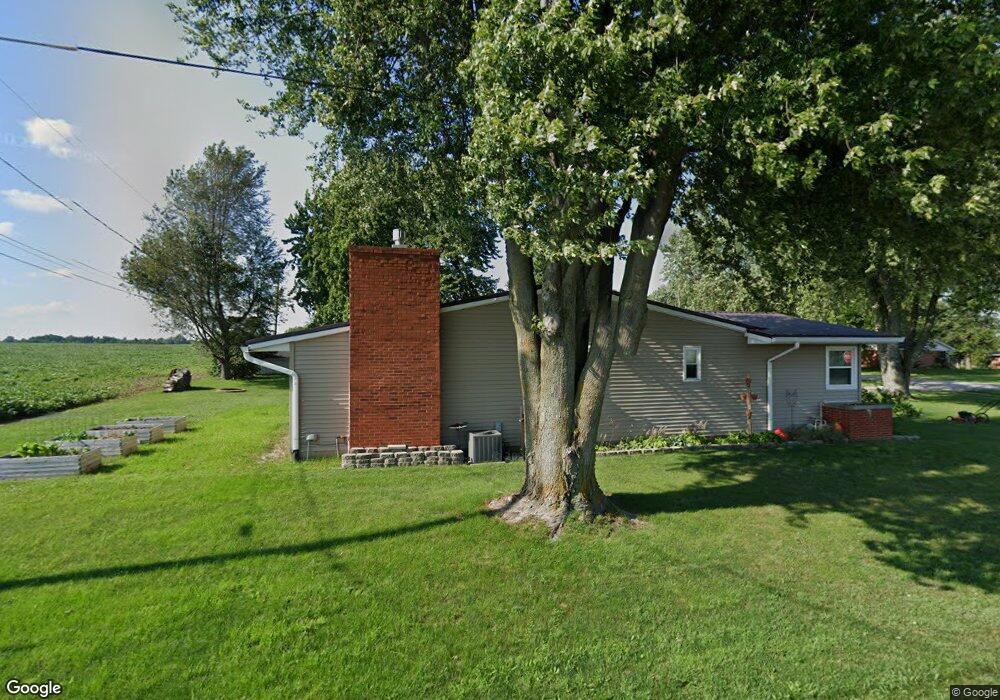
514 S Main St West Unity, OH 43570
Estimated Value: $168,426 - $218,000
3
Beds
1
Bath
2,186
Sq Ft
$84/Sq Ft
Est. Value
About This Home
This home is located at 514 S Main St, West Unity, OH 43570 and is currently estimated at $184,357, approximately $84 per square foot. 514 S Main St is a home located in Williams County with nearby schools including Hilltop Elementary School and Hilltop High School.
Ownership History
Date
Name
Owned For
Owner Type
Purchase Details
Closed on
Sep 26, 2012
Sold by
D & B Colon Leasing Llc
Bought by
Smith Justin M and Smith Lindsey N
Current Estimated Value
Home Financials for this Owner
Home Financials are based on the most recent Mortgage that was taken out on this home.
Original Mortgage
$84,700
Outstanding Balance
$57,768
Interest Rate
3.57%
Mortgage Type
Purchase Money Mortgage
Estimated Equity
$126,589
Purchase Details
Closed on
Jul 14, 2011
Sold by
Secretary Of Veterans Affairs
Bought by
D & B Colon Leasing Llc
Purchase Details
Closed on
Oct 1, 2010
Sold by
Patterson Daniel R
Bought by
Secretary Of Veterans Affairs
Purchase Details
Closed on
Aug 28, 2003
Sold by
Beers Christopher M and Beers Cheryl L
Bought by
Patterson Daniel R and Patterson Cheryl
Purchase Details
Closed on
Jul 24, 1996
Sold by
Hooser Curt
Bought by
Beers Christopher M and Beers Cheryl L
Purchase Details
Closed on
Jul 2, 1992
Bought by
Hooser Curt
Create a Home Valuation Report for This Property
The Home Valuation Report is an in-depth analysis detailing your home's value as well as a comparison with similar homes in the area
Purchase History
| Date | Buyer | Sale Price | Title Company |
|---|---|---|---|
| Smith Justin M | $89,300 | None Available | |
| D & B Colon Leasing Llc | -- | None Available | |
| Secretary Of Veterans Affairs | $73,830 | None Available | |
| Patterson Daniel R | $82,000 | -- | |
| Beers Christopher M | $74,000 | -- | |
| Hooser Curt | $58,500 | -- |
Source: Public Records
Mortgage History
| Date | Status | Borrower | Loan Amount |
|---|---|---|---|
| Open | Smith Justin M | $84,700 |
Source: Public Records
Tax History
| Year | Tax Paid | Tax Assessment Tax Assessment Total Assessment is a certain percentage of the fair market value that is determined by local assessors to be the total taxable value of land and additions on the property. | Land | Improvement |
|---|---|---|---|---|
| 2025 | $1,888 | $47,990 | $4,900 | $43,090 |
| 2024 | $1,888 | $47,990 | $4,900 | $43,090 |
| 2023 | $1,921 | $39,380 | $4,870 | $34,510 |
| 2022 | $1,874 | $39,380 | $4,870 | $34,510 |
| 2021 | $1,874 | $39,380 | $4,870 | $34,510 |
| 2020 | $1,691 | $34,240 | $4,240 | $30,000 |
| 2019 | $1,661 | $34,240 | $4,240 | $30,000 |
| 2018 | $1,601 | $34,240 | $4,240 | $30,000 |
| 2017 | $1,595 | $32,560 | $4,030 | $28,530 |
| 2016 | $1,523 | $32,560 | $4,030 | $28,530 |
| 2015 | $1,736 | $32,560 | $4,030 | $28,530 |
| 2014 | $1,736 | $34,270 | $4,240 | $30,030 |
| 2013 | $1,719 | $34,270 | $4,240 | $30,030 |
Source: Public Records
Map
Nearby Homes
- 111 Leigh Rd
- 000 W Jackson
- 611 W Jackson St
- 613 W Jackson St
- 108 E Rings St
- 402 N Liberty St
- 502 N Lincoln St
- 11017 County Road 22
- 9019 19-50 Rd
- 22227 Us Highway 20a
- 8906 County Road 21
- 8437 18 Rd
- 21184 20n Rd Unit Tract 1
- 21184 20n Rd Unit Tract 3
- 20-n Road Unit Tract 2
- 301 Horton St
- 314 W Curtis St
- 303 E Curtis St
- 200 Tyler Ln
- 302 Tyler Ln
Your Personal Tour Guide
Ask me questions while you tour the home.