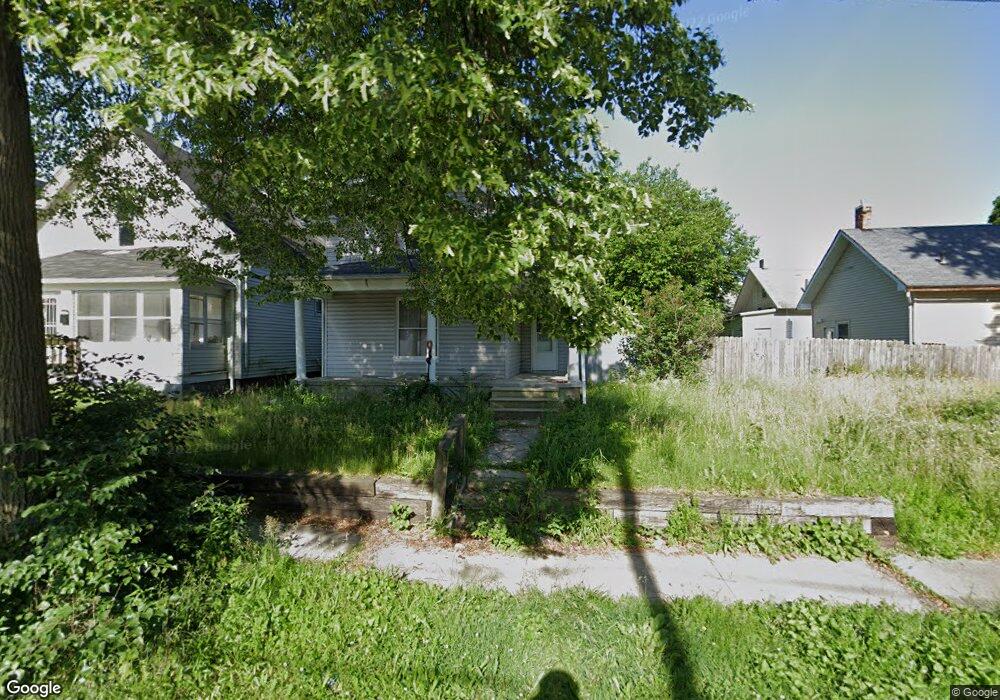
514 Spring Grove Ave Toledo, OH 43605
East Toledo NeighborhoodEstimated Value: $62,576 - $76,000
3
Beds
1
Bath
1,222
Sq Ft
$57/Sq Ft
Est. Value
About This Home
This home is located at 514 Spring Grove Ave, Toledo, OH 43605 and is currently estimated at $69,144, approximately $56 per square foot. 514 Spring Grove Ave is a home located in Lucas County with nearby schools including Raymer Elementary School, Waite High School, and Toledo Preparatory Academy.
Ownership History
Date
Name
Owned For
Owner Type
Purchase Details
Closed on
Jul 27, 2007
Sold by
Shultz John and Dubbs Deborah
Bought by
Barto Paul R and Barto Susan
Current Estimated Value
Purchase Details
Closed on
Dec 22, 2006
Sold by
Aurora Loan Services Llc
Bought by
Shultz John and Dubbs Deborah
Purchase Details
Closed on
Apr 18, 2006
Sold by
Sheehy Daniel M
Bought by
Aurora Loan Services Llc
Purchase Details
Closed on
Dec 17, 1999
Sold by
Carr David M
Bought by
Sheeh Daniel M
Home Financials for this Owner
Home Financials are based on the most recent Mortgage that was taken out on this home.
Original Mortgage
$10,500
Interest Rate
10%
Mortgage Type
Seller Take Back
Purchase Details
Closed on
Mar 18, 1997
Sold by
Trst William G Krapp
Bought by
Carr David M
Purchase Details
Closed on
May 27, 1988
Sold by
Krapp William G
Create a Home Valuation Report for This Property
The Home Valuation Report is an in-depth analysis detailing your home's value as well as a comparison with similar homes in the area
Home Values in the Area
Average Home Value in this Area
Purchase History
| Date | Buyer | Sale Price | Title Company |
|---|---|---|---|
| Barto Paul R | $53,000 | Attorney | |
| Shultz John | $22,000 | Chicago Title Insurance Co | |
| Aurora Loan Services Llc | $36,000 | None Available | |
| Sheeh Daniel M | $49,900 | Midland | |
| Carr David M | $12,000 | -- | |
| -- | -- | -- |
Source: Public Records
Mortgage History
| Date | Status | Borrower | Loan Amount |
|---|---|---|---|
| Previous Owner | Sheeh Daniel M | $10,500 |
Source: Public Records
Tax History Compared to Growth
Tax History
| Year | Tax Paid | Tax Assessment Tax Assessment Total Assessment is a certain percentage of the fair market value that is determined by local assessors to be the total taxable value of land and additions on the property. | Land | Improvement |
|---|---|---|---|---|
| 2024 | $11,490 | $13,405 | $4,025 | $9,380 |
| 2023 | $984 | $13,265 | $4,515 | $8,750 |
| 2022 | $981 | $13,265 | $4,515 | $8,750 |
| 2021 | $974 | $13,265 | $4,515 | $8,750 |
| 2020 | $959 | $11,200 | $3,780 | $7,420 |
| 2019 | $925 | $11,200 | $3,780 | $7,420 |
| 2018 | $917 | $11,200 | $3,780 | $7,420 |
| 2017 | $968 | $10,955 | $3,710 | $7,245 |
| 2016 | $1,445 | $31,300 | $10,600 | $20,700 |
| 2015 | $908 | $31,300 | $10,600 | $20,700 |
| 2014 | $708 | $10,960 | $3,710 | $7,250 |
| 2013 | $708 | $10,960 | $3,710 | $7,250 |
Source: Public Records
Map
Nearby Homes
- 1601 Nevada St
- 1702 Starr Ave
- 444 Raymer Blvd
- 566 Howland Ave
- 527 White St
- 1912 Greenwood Ave
- 463 Howland Ave
- 1418 Nevada St
- 558 Thurston St
- 661 Howland Ave
- 1308 Starr Ave
- 636 White St
- 715 Raymer Blvd
- 1940 Hurd St
- 1207 Nevada St
- 368 Plymouth St
- 1202 Nevada St
- 1525 Kelsey Ave
- 643 Willard St
- 1326 Kelsey Ave
- 516 Spring Grove Ave
- 1620 Greenwood Ave
- 1624 Greenwood Ave
- 520 Spring Grove Ave
- 1616 Greenwood Ave
- 1628 Greenwood Ave
- 1612 Greenwood Ave
- 522 Spring Grove Ave
- 1610 Greenwood Ave
- 509 Valleywood Dr
- 1702 Greenwood Ave
- 515 Valleywood Dr
- 526 Spring Grove Ave
- 519 Valleywood Dr
- 1701 Delence St
- 521 Valleywood Dr
- 1602 Greenwood Ave
- 530 Spring Grove Ave
- 1705 Delence St
- 523 Valleywood Dr