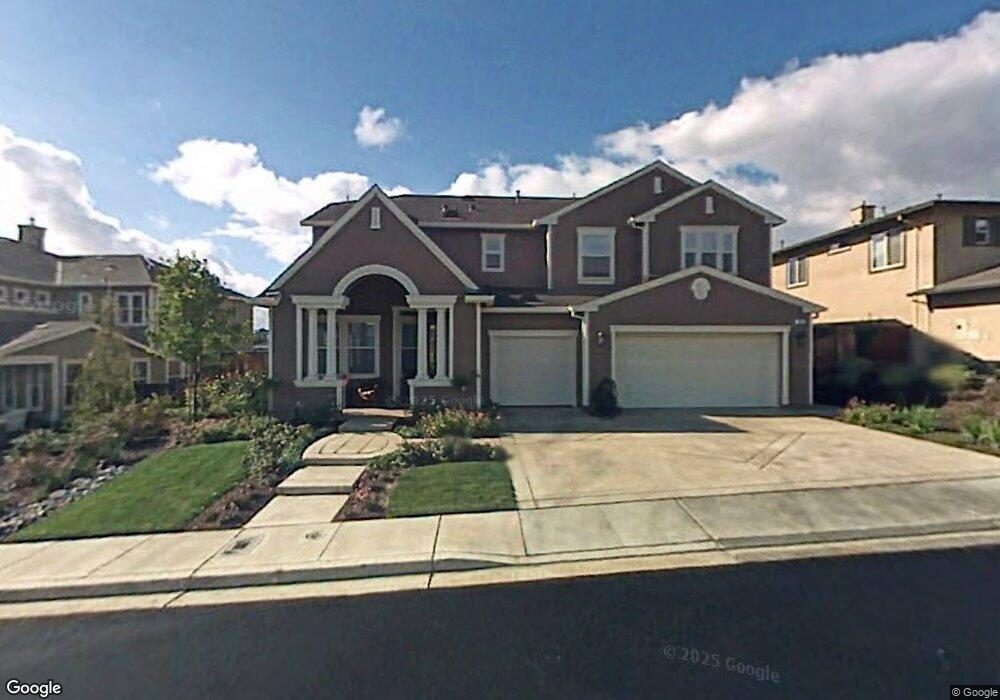
514 Townsend Dr Benicia, CA 94510
Estimated Value: $1,101,000 - $1,245,000
5
Beds
4
Baths
3,162
Sq Ft
$376/Sq Ft
Est. Value
About This Home
This home is located at 514 Townsend Dr, Benicia, CA 94510 and is currently estimated at $1,187,717, approximately $375 per square foot. 514 Townsend Dr is a home located in Solano County with nearby schools including Matthew Turner Elementary School, Benicia Middle School, and Benicia High School.
Ownership History
Date
Name
Owned For
Owner Type
Purchase Details
Closed on
Sep 14, 2021
Sold by
Birkhead Christine
Bought by
Birkhead Christine and The Chrnistine Birkhead Family
Current Estimated Value
Purchase Details
Closed on
Aug 10, 2011
Sold by
Belisle Thomas R and Belisle Maryann S
Bought by
Birkhead David and Deans Christine E
Home Financials for this Owner
Home Financials are based on the most recent Mortgage that was taken out on this home.
Original Mortgage
$400,000
Outstanding Balance
$276,438
Interest Rate
4.53%
Mortgage Type
New Conventional
Estimated Equity
$911,279
Purchase Details
Closed on
Jun 27, 2006
Sold by
Centex Homes
Bought by
Belisle Thomas R and Belisle Maryann S
Home Financials for this Owner
Home Financials are based on the most recent Mortgage that was taken out on this home.
Original Mortgage
$659,800
Interest Rate
6.55%
Mortgage Type
Negative Amortization
Purchase Details
Closed on
Sep 23, 2005
Sold by
Benicia Cs Developers Llc
Bought by
Centex Homes
Create a Home Valuation Report for This Property
The Home Valuation Report is an in-depth analysis detailing your home's value as well as a comparison with similar homes in the area
Home Values in the Area
Average Home Value in this Area
Purchase History
| Date | Buyer | Sale Price | Title Company |
|---|---|---|---|
| Birkhead Christine | -- | None Available | |
| Birkhead David | $500,000 | First American Title Company | |
| Belisle Thomas R | $825,000 | First American Title Co | |
| Centex Homes | -- | First American Title Co |
Source: Public Records
Mortgage History
| Date | Status | Borrower | Loan Amount |
|---|---|---|---|
| Open | Birkhead David | $400,000 | |
| Previous Owner | Belisle Thomas R | $659,800 |
Source: Public Records
Tax History
| Year | Tax Paid | Tax Assessment Tax Assessment Total Assessment is a certain percentage of the fair market value that is determined by local assessors to be the total taxable value of land and additions on the property. | Land | Improvement |
|---|---|---|---|---|
| 2025 | $9,444 | $628,015 | $157,001 | $471,014 |
| 2024 | $9,444 | $615,702 | $153,923 | $461,779 |
| 2023 | $9,282 | $603,630 | $150,905 | $452,725 |
| 2022 | $9,128 | $591,796 | $147,947 | $443,849 |
| 2021 | $9,028 | $580,194 | $145,047 | $435,147 |
| 2020 | $8,942 | $574,246 | $143,560 | $430,686 |
| 2019 | $8,542 | $562,988 | $140,746 | $422,242 |
| 2018 | $8,623 | $551,950 | $137,987 | $413,963 |
| 2017 | $8,493 | $541,129 | $135,282 | $405,847 |
| 2016 | $8,530 | $530,520 | $132,630 | $397,890 |
| 2015 | $8,358 | $522,552 | $130,638 | $391,914 |
| 2014 | $8,293 | $512,316 | $128,079 | $384,237 |
Source: Public Records
Map
Nearby Homes
- 477 Arguello Dr
- 628 Stephen Ct
- 670 Hubbs Ct
- 456 Lansing Cir
- 358 Mccall Dr
- 491 Gray Ct
- 387 Allen Way
- 154 Panorama Dr
- 365 Allen Way
- 570 Periwinkle Place
- 164 Carlisle Way
- 101 Panorama Dr
- 2 Lake Herman Rd
- 403 Gerald Ct
- 97 Carlisle Way
- 137 Chelsea Hills Dr
- 494 Mills Dr
- 771 Rose Dr
- 309 Drake Ct
- 513 Toyon Place
- 520 Townsend Dr
- 508 Townsend Dr
- 485 Arguello Dr
- 483 Arguello Dr
- 526 Townsend Dr
- 489 Arguello Dr
- 502 Townsend Dr
- 513 Townsend Dr
- 519 Townsend Dr
- 507 Townsend Dr
- 481 Arguello Dr
- 493 Arguello Dr
- 525 Townsend Dr
- 532 Townsend Dr
- 501 Townsend Dr
- 492 Townsend Dr
- 531 Townsend Dr
- 495 Townsend Dr
- 497 Arguello Dr
- 731 Kearney St
Your Personal Tour Guide
Ask me questions while you tour the home.