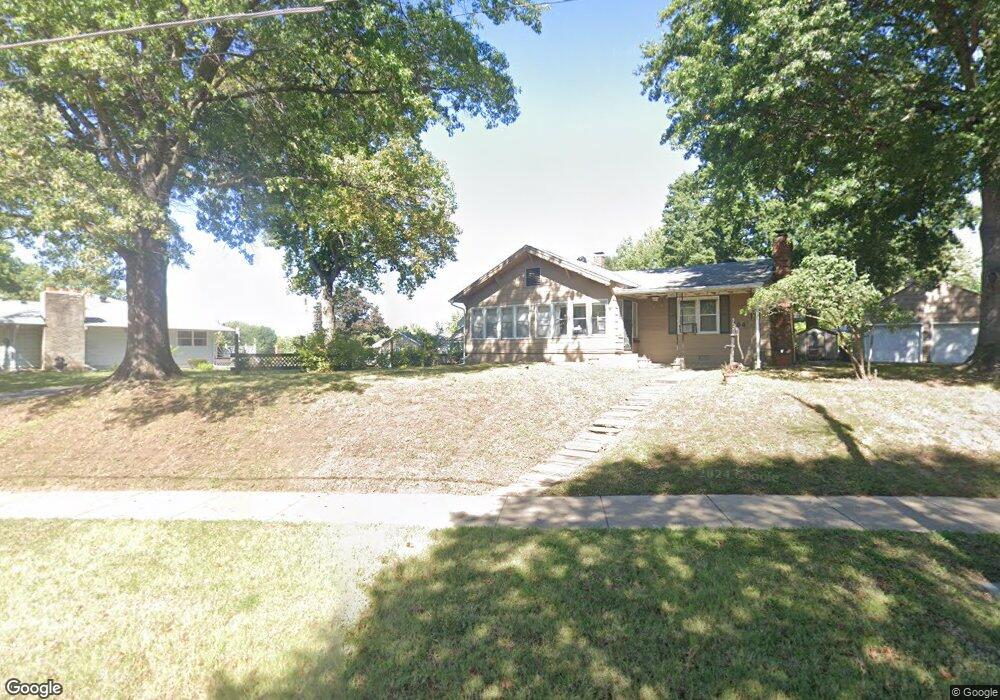
514 W Southside Blvd Independence, MO 64055
Three Trails NeighborhoodEstimated Value: $93,063 - $160,000
2
Beds
1
Bath
863
Sq Ft
$144/Sq Ft
Est. Value
About This Home
This home is located at 514 W Southside Blvd, Independence, MO 64055 and is currently estimated at $124,016, approximately $143 per square foot. 514 W Southside Blvd is a home located in Jackson County with nearby schools including Santa Fe Trail Elementary School, Bridger Middle School, and Pioneer Ridge Middle School.
Ownership History
Date
Name
Owned For
Owner Type
Purchase Details
Closed on
May 7, 2012
Sold by
Hightower John T and Hightower Deangela
Bought by
City Of Kansas City
Current Estimated Value
Purchase Details
Closed on
Jan 26, 2011
Sold by
York Teresa L
Bought by
Davenport Kevin
Purchase Details
Closed on
May 14, 2007
Sold by
Davis Virginia Pearl
Bought by
Hightower John T
Home Financials for this Owner
Home Financials are based on the most recent Mortgage that was taken out on this home.
Original Mortgage
$29,000
Interest Rate
6.22%
Mortgage Type
Purchase Money Mortgage
Purchase Details
Closed on
Oct 8, 2005
Sold by
Davis Virginia Pearl and Richard Harris H
Bought by
Davis Virginia P and Lloyd V Davis Trust
Purchase Details
Closed on
Mar 6, 2005
Sold by
Davis Lloyd Vernon and Davis Virginia Pearl
Bought by
Davis Virginia Pearl and Davis Richard Harris
Purchase Details
Closed on
Sep 19, 2002
Sold by
Jones Julia Marie
Bought by
Worden Eugene Wray and Worden Mary E
Create a Home Valuation Report for This Property
The Home Valuation Report is an in-depth analysis detailing your home's value as well as a comparison with similar homes in the area
Home Values in the Area
Average Home Value in this Area
Purchase History
| Date | Buyer | Sale Price | Title Company |
|---|---|---|---|
| City Of Kansas City | -- | First American Title Insuran | |
| Davenport Kevin | $6,900 | None Available | |
| Hightower John T | -- | Title Enterprises | |
| Davis Virginia P | -- | -- | |
| Davis Virginia Pearl | -- | -- | |
| Worden Eugene Wray | -- | -- |
Source: Public Records
Mortgage History
| Date | Status | Borrower | Loan Amount |
|---|---|---|---|
| Previous Owner | Hightower John T | $29,000 |
Source: Public Records
Tax History Compared to Growth
Tax History
| Year | Tax Paid | Tax Assessment Tax Assessment Total Assessment is a certain percentage of the fair market value that is determined by local assessors to be the total taxable value of land and additions on the property. | Land | Improvement |
|---|---|---|---|---|
| 2025 | $226 | $3,758 | $3,507 | $251 |
| 2024 | $226 | $3,268 | $1,900 | $1,368 |
| 2023 | $221 | $13,959 | $1,142 | $12,817 |
| 2022 | $211 | $2,850 | $2,280 | $570 |
| 2021 | $210 | $2,850 | $2,280 | $570 |
| 2020 | $212 | $4,125 | $2,280 | $1,845 |
| 2019 | $308 | $4,125 | $2,280 | $1,845 |
| 2018 | $218 | $2,787 | $1,761 | $1,026 |
| 2017 | $215 | $2,787 | $1,761 | $1,026 |
| 2016 | $215 | $2,717 | $1,761 | $956 |
| 2014 | $487 | $6,289 | $1,710 | $4,579 |
Source: Public Records
Map
Nearby Homes
- 701 W 24th St
- 1215 S Delaware Ave
- 1335 S Osage St
- 1337 S Osage St
- 1216 S Osage St
- 1511 W 23rd St S
- 712 W 23rd St S
- 1215 S Osage St
- 1223 S Osage St
- 832 W Charles St
- 1226 Windsor St
- 1224 Windsor St
- 501 W South Ave
- 1106 S Osage St
- 1424 S Liberty St
- 908 S Delaware St
- 421 W Sea Ave
- 1122 S Main St
- 334 W Sea Ave
- 900 S Osage St
- 1247 S Mccoy St
- 504 W Southside Blvd
- 1243 S Mccoy St
- 500 W Southside Blvd
- 1240 S Pleasant St
- 505 W Southside Blvd
- 515 W Southside Blvd
- 501 W Southside Blvd
- 1241 S Mccoy St
- 1239 S Mccoy St
- 1238 S Pleasant St
- 523 W Southside Blvd
- 601 W 24th St
- 1235 S Mccoy St
- 1248 S Mccoy St
- 421 W Southside Blvd
- 1236 S Pleasant St
- 420 W Southside Blvd
- 521 W Southside Blvd
- 1311 S Pleasant St