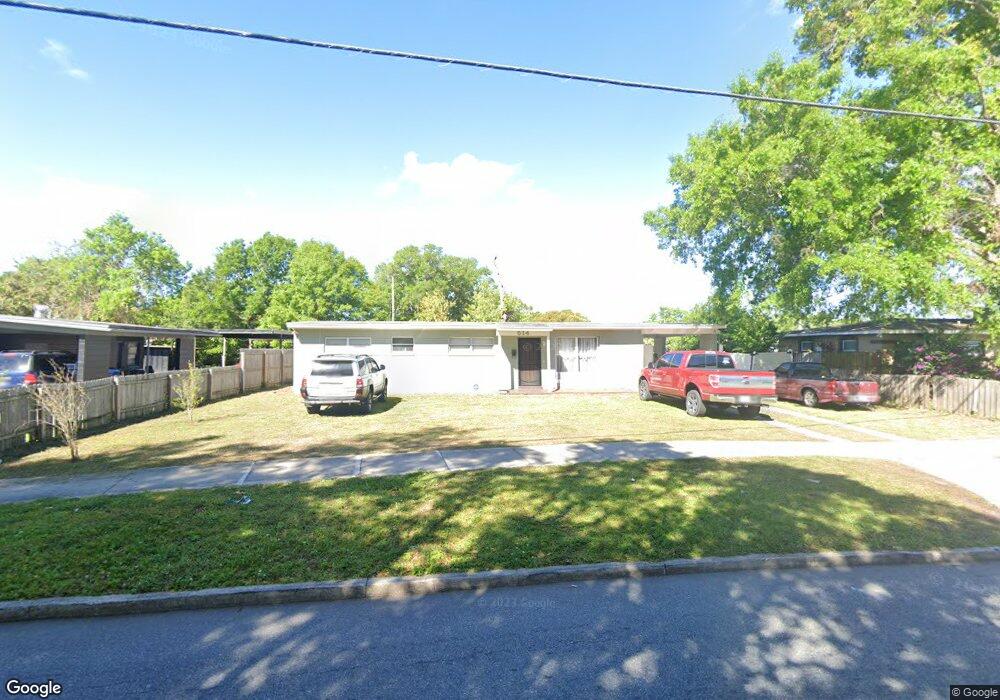
514 Yucatan Dr Orlando, FL 32807
Engelwood Park NeighborhoodEstimated Value: $277,787 - $324,000
3
Beds
2
Baths
1,102
Sq Ft
$272/Sq Ft
Est. Value
About This Home
This home is located at 514 Yucatan Dr, Orlando, FL 32807 and is currently estimated at $299,697, approximately $271 per square foot. 514 Yucatan Dr is a home located in Orange County with nearby schools including Engelwood Elementary School, Roberto Clemente Middle School, and Colonial High School.
Ownership History
Date
Name
Owned For
Owner Type
Purchase Details
Closed on
Feb 17, 2017
Sold by
Murphy Development Inc
Bought by
Singh Avneet and Kaur Inderdeep
Current Estimated Value
Home Financials for this Owner
Home Financials are based on the most recent Mortgage that was taken out on this home.
Original Mortgage
$129,600
Outstanding Balance
$63,502
Interest Rate
3.37%
Mortgage Type
New Conventional
Estimated Equity
$236,195
Purchase Details
Closed on
Sep 1, 2016
Bought by
Singh Avneet
Purchase Details
Closed on
Oct 26, 2009
Sold by
Pietruszka Kim
Bought by
Federal National Mortgage Association
Purchase Details
Closed on
May 22, 2000
Sold by
Mutius Katherine A Von
Bought by
Vonmutius Katherine A
Home Financials for this Owner
Home Financials are based on the most recent Mortgage that was taken out on this home.
Original Mortgage
$30,000
Interest Rate
8.2%
Mortgage Type
New Conventional
Create a Home Valuation Report for This Property
The Home Valuation Report is an in-depth analysis detailing your home's value as well as a comparison with similar homes in the area
Home Values in the Area
Average Home Value in this Area
Purchase History
| Date | Buyer | Sale Price | Title Company |
|---|---|---|---|
| Singh Avneet | $162,000 | Fidelity National Title Of F | |
| Singh Avneet | $92,600 | -- | |
| Federal National Mortgage Association | -- | None Available | |
| Vonmutius Katherine A | -- | -- |
Source: Public Records
Mortgage History
| Date | Status | Borrower | Loan Amount |
|---|---|---|---|
| Open | Singh Avneet | $129,600 | |
| Previous Owner | Vonmutius Katherine A | $76,000 | |
| Previous Owner | Vonmutius Katherine A | $15,000 | |
| Previous Owner | Vonmutius Katherine A | $30,000 |
Source: Public Records
Tax History Compared to Growth
Tax History
| Year | Tax Paid | Tax Assessment Tax Assessment Total Assessment is a certain percentage of the fair market value that is determined by local assessors to be the total taxable value of land and additions on the property. | Land | Improvement |
|---|---|---|---|---|
| 2025 | $4,059 | $255,490 | $105,000 | $150,490 |
| 2024 | $3,646 | $229,860 | $105,000 | $124,860 |
| 2023 | $3,646 | $197,556 | $92,000 | $105,556 |
| 2022 | $3,361 | $183,248 | $100,000 | $83,248 |
| 2021 | $3,066 | $159,032 | $85,000 | $74,032 |
| 2020 | $1,631 | $124,941 | $0 | $0 |
| 2019 | $1,672 | $122,132 | $55,000 | $67,132 |
| 2018 | $1,836 | $129,701 | $45,000 | $84,701 |
| 2017 | $1,940 | $93,839 | $30,000 | $63,839 |
| 2016 | $1,630 | $76,270 | $24,000 | $52,270 |
| 2015 | $651 | $74,282 | $23,000 | $51,282 |
| 2014 | $655 | $59,673 | $23,000 | $36,673 |
Source: Public Records
Map
Nearby Homes
- 5770 Crane Place
- 635 Yucatan Dr
- 6031 Chenango Ln
- 5875 Talavera St
- 6200 Appian Way
- 5607 Andora St
- 6124 Dogwood Dr
- 978 Calanda Ave
- 901 S Solandra Dr
- 975 Alicante Ave
- 821 Thalia Dr
- 1002 Oropesa Ave
- 715 Mercado Ct
- 519 Mercado Ave
- 832 Thalia Dr
- 6310 Lake Underhill Rd
- 6021 Yucatan Dr
- 6316 Lake Underhill Rd
- 6322 Appian Way
- 191 Dahlia Village Cir Unit GE