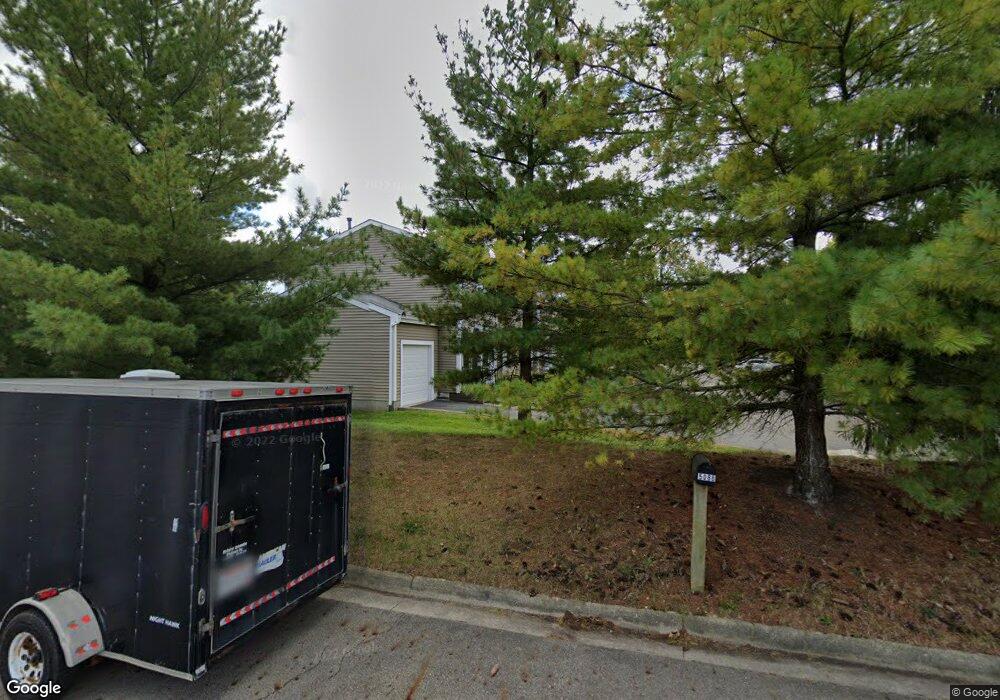
5140 Singleton Dr Hilliard, OH 43026
Cross Creek NeighborhoodEstimated Value: $190,000 - $201,000
2
Beds
1
Bath
839
Sq Ft
$233/Sq Ft
Est. Value
About This Home
This home is located at 5140 Singleton Dr, Hilliard, OH 43026 and is currently estimated at $195,754, approximately $233 per square foot. 5140 Singleton Dr is a home located in Franklin County with nearby schools including Hilliard Crossing Elementary School, Hilliard Station Sixth Grade Elementary School, and Hilliard Heritage Middle School.
Ownership History
Date
Name
Owned For
Owner Type
Purchase Details
Closed on
Feb 2, 2021
Sold by
Muse Michael Wayne and Muse Yong H
Bought by
Jeffrey Jarred
Current Estimated Value
Home Financials for this Owner
Home Financials are based on the most recent Mortgage that was taken out on this home.
Original Mortgage
$119,000
Outstanding Balance
$105,358
Interest Rate
2.65%
Mortgage Type
New Conventional
Estimated Equity
$90,396
Purchase Details
Closed on
Jul 5, 2018
Sold by
Wine Darline
Bought by
Muse Christopher Michael and Muse Michael Wayne
Home Financials for this Owner
Home Financials are based on the most recent Mortgage that was taken out on this home.
Original Mortgage
$88,000
Interest Rate
4.5%
Mortgage Type
New Conventional
Purchase Details
Closed on
Jul 1, 1994
Sold by
Ting Hak Kim
Bought by
Wine Darline
Home Financials for this Owner
Home Financials are based on the most recent Mortgage that was taken out on this home.
Original Mortgage
$41,200
Interest Rate
8.66%
Mortgage Type
New Conventional
Purchase Details
Closed on
Jul 19, 1991
Create a Home Valuation Report for This Property
The Home Valuation Report is an in-depth analysis detailing your home's value as well as a comparison with similar homes in the area
Home Values in the Area
Average Home Value in this Area
Purchase History
| Date | Buyer | Sale Price | Title Company |
|---|---|---|---|
| Jeffrey Jarred | $140,000 | Northwest Select Ttl Agcy Ll | |
| Muse Christopher Michael | $113,000 | None Available | |
| Wine Darline | $61,200 | -- | |
| -- | $55,700 | -- |
Source: Public Records
Mortgage History
| Date | Status | Borrower | Loan Amount |
|---|---|---|---|
| Open | Jeffrey Jarred | $119,000 | |
| Previous Owner | Muse Christopher Michael | $88,000 | |
| Previous Owner | Wine Darline | $41,200 |
Source: Public Records
Tax History
| Year | Tax Paid | Tax Assessment Tax Assessment Total Assessment is a certain percentage of the fair market value that is determined by local assessors to be the total taxable value of land and additions on the property. | Land | Improvement |
|---|---|---|---|---|
| 2025 | $2,732 | $48,370 | $9,800 | $38,570 |
| 2024 | $2,732 | $48,370 | $9,800 | $38,570 |
| 2023 | $2,367 | $48,370 | $9,800 | $38,570 |
| 2022 | $2,411 | $39,450 | $4,590 | $34,860 |
| 2021 | $2,408 | $39,450 | $4,590 | $34,860 |
| 2020 | $2,401 | $39,450 | $4,590 | $34,860 |
| 2019 | $1,939 | $27,200 | $3,150 | $24,050 |
| 2018 | $1,831 | $27,200 | $3,150 | $24,050 |
| 2017 | $1,889 | $27,200 | $3,150 | $24,050 |
| 2016 | $1,846 | $24,090 | $3,400 | $20,690 |
| 2015 | $1,731 | $24,090 | $3,400 | $20,690 |
| 2014 | $1,734 | $24,090 | $3,400 | $20,690 |
| 2013 | $976 | $26,775 | $3,780 | $22,995 |
Source: Public Records
Map
Nearby Homes
- 5160 Singleton Dr Unit 43D
- 5083 Singleton Dr Unit 33b
- 5066 Ivywild Ave
- 2759 Lyndley Ct
- 5176 Skytrail Dr
- 5380 Carjan Way
- 5052 Bressler Dr
- 5285 Redlands Dr
- 2505 Roberts Ct
- 5138 Roberts Rd
- 4771 Perlman St Unit 14
- 5082 Springdale Blvd Unit 31E
- 2477 Crystal Springs Dr
- 4923 Stoneybrook Blvd Unit 21F
- 5288 Hyde Park Dr
- 2921 Mondavi Ln
- 2385 Yagger Bay Dr
- 2464 Meadow Glade Dr Unit 2464
- 4920 Meadow Run Dr Unit 4920
- 2571 Rustling Oak Blvd
- 5142 Singleton Dr
- 5140 Singleton Dr Unit 41D
- 5144 Singleton Dr Unit 41B
- 5146 Singleton Dr
- 5146 Singleton Dr Unit 41A
- 5133 Singleton Dr Unit 42B
- 5131 Singleton Dr Unit 42A
- 5164 Singleton Dr Unit 43B
- 5126 Singleton Dr
- 5122 Singleton Dr
- 5162 Singleton Dr
- 5162 Singleton Dr Unit 43C
- 5166 Singleton Dr Unit 43A
- 5124 Singleton Dr Unit 36B
- 5135 Singleton Dr Unit 42C
- 5127 Singleton Dr
- 5127 Singleton Dr Unit 37D
- 5120 Singleton Dr
- 5155 Singleton Dr Unit 44C
- 5157 Singleton Dr Unit 44D
Your Personal Tour Guide
Ask me questions while you tour the home.