
Landlord's Agent in 2025
Chris Atha
eXp Realty
(563) 468-0748
5 in this area
62 Total Sales
Estimated Value: $283,000 - $322,000
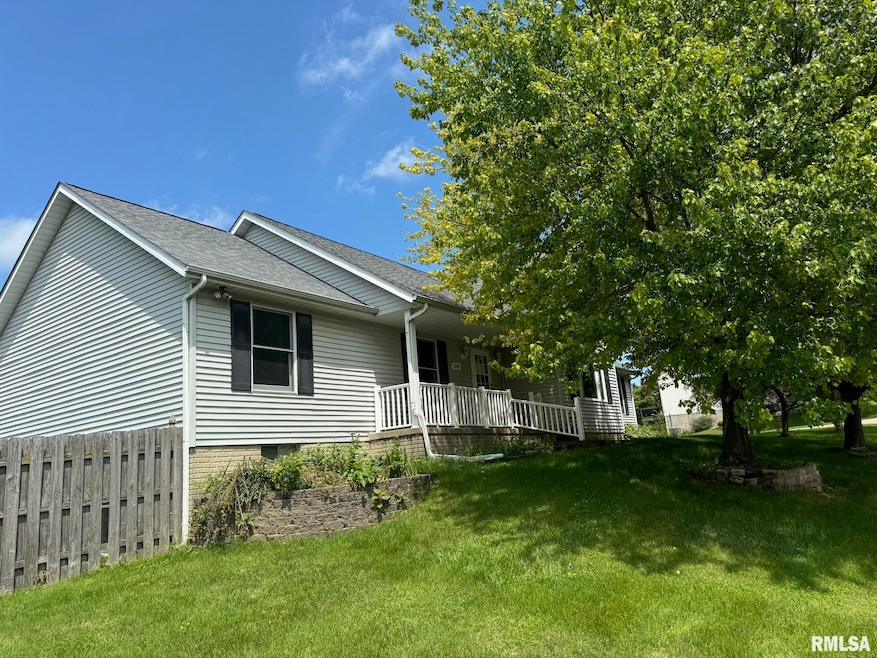
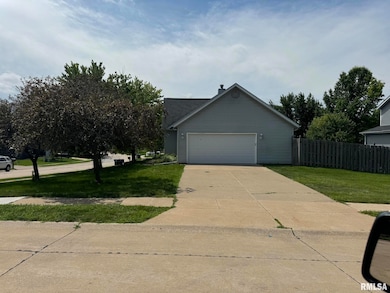
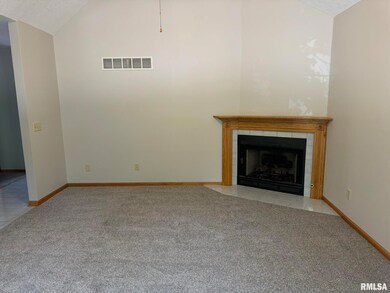
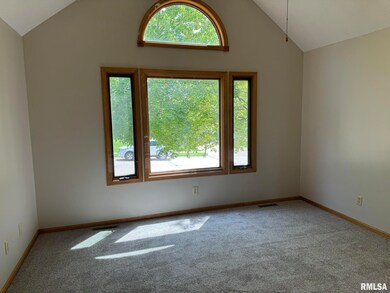
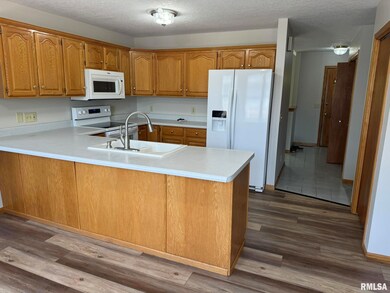
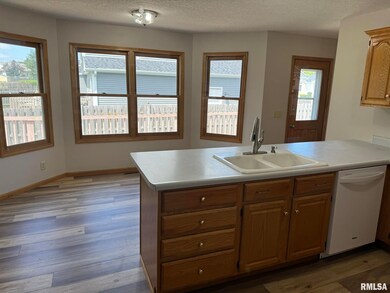
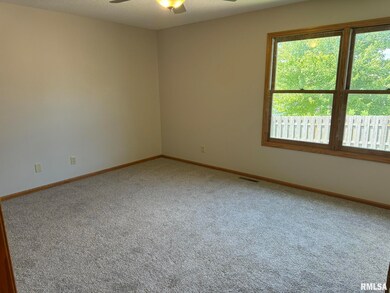
Four bedroom ranch available now in NW Davenport. House was just repainted, new flooring in kitchen and new carpet in bedrooms and basement rec room, 3 full baths, attached 2 car garage, main floor laundry and mud room, fenced yard. Pets welcome with owner approval and additional pet fee at move in. Owner does not accept the Section 8 voucher. Security deposit of $2,200, each adult to complete $30 credit/background check. Tenant pays all utilities and performs lawncare and snow removal.
Last Agent to Rent the Property
eXp Realty Brokerage Phone: 563-468-0748 License #475.178691/S66710000 Listed on: 08/07/2024
Last Renter's Agent
eXp Realty Brokerage Phone: 563-468-0748 License #475.178691/S66710000 Listed on: 08/07/2024
| Date | Buyer | Sale Price | Title Company |
|---|---|---|---|
| Foley Samuel N | $165,000 | None Available |
| Date | Status | Borrower | Loan Amount |
|---|---|---|---|
| Open | Foley Samuel N | $123,750 |
| Date | Event | Price | List to Sale | Price per Sq Ft |
|---|---|---|---|---|
| 01/23/2025 01/23/25 | Rented | $2,200 | 0.0% | -- |
| 11/27/2024 11/27/24 | Price Changed | $2,200 | -4.3% | $1 / Sq Ft |
| 08/07/2024 08/07/24 | For Rent | $2,300 | +39.4% | -- |
| 03/14/2015 03/14/15 | Rented | $1,650 | -13.2% | -- |
| 03/14/2015 03/14/15 | Under Contract | -- | -- | -- |
| 01/26/2015 01/26/15 | For Rent | $1,900 | +18.8% | -- |
| 09/02/2014 09/02/14 | Rented | $1,600 | -15.8% | -- |
| 09/02/2014 09/02/14 | Under Contract | -- | -- | -- |
| 08/06/2014 08/06/14 | For Rent | $1,900 | -- | -- |
| Year | Tax Paid | Tax Assessment Tax Assessment Total Assessment is a certain percentage of the fair market value that is determined by local assessors to be the total taxable value of land and additions on the property. | Land | Improvement |
|---|---|---|---|---|
| 2025 | $4,588 | $274,560 | $52,640 | $221,920 |
| 2024 | $5,090 | $256,700 | $52,640 | $204,060 |
| 2023 | $4,885 | $256,700 | $52,640 | $204,060 |
| 2022 | $4,908 | $216,500 | $48,880 | $167,620 |
| 2021 | $4,646 | $216,500 | $48,880 | $167,620 |
| 2020 | $4,248 | $203,610 | $48,880 | $154,730 |
| 2019 | $4,170 | $185,880 | $48,880 | $137,000 |
| 2018 | $4,082 | $185,880 | $48,880 | $137,000 |
| 2017 | $1,034 | $185,880 | $48,880 | $137,000 |
| 2016 | $4,070 | $185,880 | $0 | $0 |
| 2015 | $4,070 | $181,960 | $0 | $0 |
| 2014 | $4,040 | $181,960 | $0 | $0 |
| 2013 | $3,972 | $0 | $0 | $0 |
| 2012 | -- | $177,440 | $45,400 | $132,040 |
Landlord's Agent in 2025
Chris Atha
eXp Realty
(563) 468-0748
5 in this area
62 Total Sales
Seller's Agent in 2015
Grant McCaulley
eXp Realty
(563) 468-1996
16 in this area
184 Total Sales
Source: RMLS Alliance
MLS Number: QC4255321
APN: M1039-48
Disclaimer: Certain information contained herein is derived from information provided by parties other than Homes.com. All information provided is deemed reliable, but is not guaranteed to be accurate and should be independently verified.
![]() IDX information is provided exclusively for personal, non-commercial use, and may not be used for any purpose other than to identify prospective properties consumers may be interested in purchasing. Information is deemed reliable but not guaranteed.
IDX information is provided exclusively for personal, non-commercial use, and may not be used for any purpose other than to identify prospective properties consumers may be interested in purchasing. Information is deemed reliable but not guaranteed.