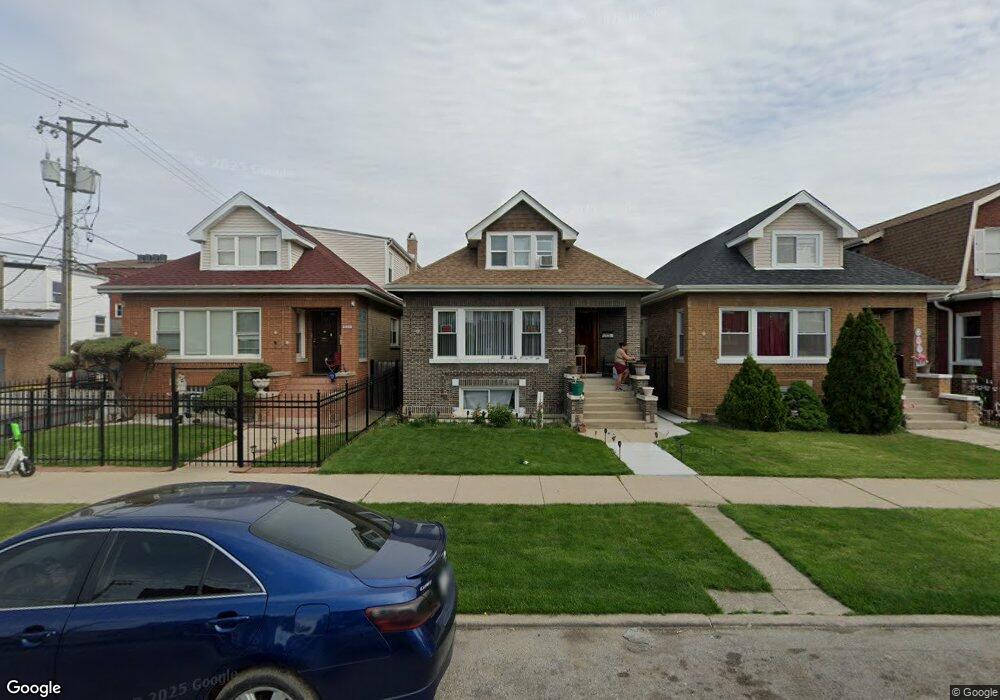
5140 W Deming Place Chicago, IL 60639
Cragin NeighborhoodEstimated Value: $308,000 - $427,000
3
Beds
1
Bath
1,151
Sq Ft
$319/Sq Ft
Est. Value
About This Home
This home is located at 5140 W Deming Place, Chicago, IL 60639 and is currently estimated at $366,623, approximately $318 per square foot. 5140 W Deming Place is a home located in Cook County with nearby schools including Schubert Elementary School, Northwest Middle School, and Foreman College and Career Academy.
Ownership History
Date
Name
Owned For
Owner Type
Purchase Details
Closed on
Jan 23, 2004
Sold by
Hernandez Marco A and Hernandez Veronica
Bought by
Garcia Valentin
Current Estimated Value
Home Financials for this Owner
Home Financials are based on the most recent Mortgage that was taken out on this home.
Original Mortgage
$212,000
Outstanding Balance
$99,557
Interest Rate
5.96%
Mortgage Type
Unknown
Estimated Equity
$267,066
Purchase Details
Closed on
Oct 1, 1998
Sold by
Hernandez Marco A and Ortiz Jose L
Bought by
Hernandez Marco A and Lua Veronica
Purchase Details
Closed on
Jun 26, 1998
Sold by
Montero Marisol
Bought by
Guerrero Martha and Ortiz Jose L
Home Financials for this Owner
Home Financials are based on the most recent Mortgage that was taken out on this home.
Original Mortgage
$127,608
Interest Rate
7.15%
Mortgage Type
FHA
Purchase Details
Closed on
Sep 20, 1996
Sold by
Montero Juan
Bought by
Montero Marisol
Purchase Details
Closed on
May 27, 1994
Sold by
Zarate Manuel
Bought by
Montero Marisol
Create a Home Valuation Report for This Property
The Home Valuation Report is an in-depth analysis detailing your home's value as well as a comparison with similar homes in the area
Home Values in the Area
Average Home Value in this Area
Purchase History
| Date | Buyer | Sale Price | Title Company |
|---|---|---|---|
| Garcia Valentin | $270,000 | Pntn | |
| Hernandez Marco A | -- | -- | |
| Guerrero Martha | $128,000 | -- | |
| Montero Marisol | -- | -- | |
| Montero Marisol | -- | -- |
Source: Public Records
Mortgage History
| Date | Status | Borrower | Loan Amount |
|---|---|---|---|
| Open | Garcia Valentin | $212,000 | |
| Previous Owner | Guerrero Martha | $127,608 |
Source: Public Records
Tax History Compared to Growth
Tax History
| Year | Tax Paid | Tax Assessment Tax Assessment Total Assessment is a certain percentage of the fair market value that is determined by local assessors to be the total taxable value of land and additions on the property. | Land | Improvement |
|---|---|---|---|---|
| 2024 | $3,815 | $27,000 | $6,882 | $20,118 |
| 2023 | $3,697 | $21,387 | $5,584 | $15,803 |
| 2022 | $3,697 | $21,387 | $5,584 | $15,803 |
| 2021 | $3,958 | $23,003 | $5,583 | $17,420 |
| 2020 | $3,516 | $18,876 | $4,650 | $14,226 |
| 2019 | $3,574 | $21,209 | $4,650 | $16,559 |
| 2018 | $3,650 | $21,900 | $4,650 | $17,250 |
| 2017 | $3,474 | $19,504 | $4,092 | $15,412 |
| 2016 | $3,408 | $19,504 | $4,092 | $15,412 |
| 2015 | $3,521 | $21,825 | $4,092 | $17,733 |
| 2014 | $3,250 | $20,070 | $3,720 | $16,350 |
| 2013 | $3,174 | $20,070 | $3,720 | $16,350 |
Source: Public Records
Map
Nearby Homes
- 2511 N Laramie Ave
- 5108 W Wrightwood Ave
- 2455 N Laramie Ave
- 5205 W Drummond Place Unit 1
- 4953 W Drummond Place
- 5233 W Parker Ave
- 5243 W Fullerton Ave
- 5330 W Drummond Place
- 5121 W Diversey Ave Unit 3N
- 2412 N Lorel Ave
- 4906 W Deming Place
- 4918-22 W Diversey Ave
- 2515 N Lotus Ave
- 2503 N Lotus Ave
- 1910 N Lockwood Ave
- 4950 W Diversey Ave
- 5254 W Wolfram St
- 2858 N Laramie Ave
- 5303 W George St
- 2218 N Lavergne Ave
- 5144 W Deming Place
- 5138 W Deming Place
- 5134 W Deming Place Unit 2
- 5134 W Deming Place
- 5132 W Deming Place
- 5128 W Deming Place
- 2535 N Laramie Ave
- 2545 N Laramie Ave
- 2539 N Laramie Ave
- 2539 N Laramie Ave
- 5143 W Wrightwood Ave
- 2547 N Laramie Ave
- 5126 W Deming Place
- 5141 W Wrightwood Ave Unit 1
- 5139 W Deming Place
- 5141 W Deming Place Unit 2FLAT
- 5141 W Deming Place
- 5145 W Deming Place Unit 1
- 5145 W Deming Place