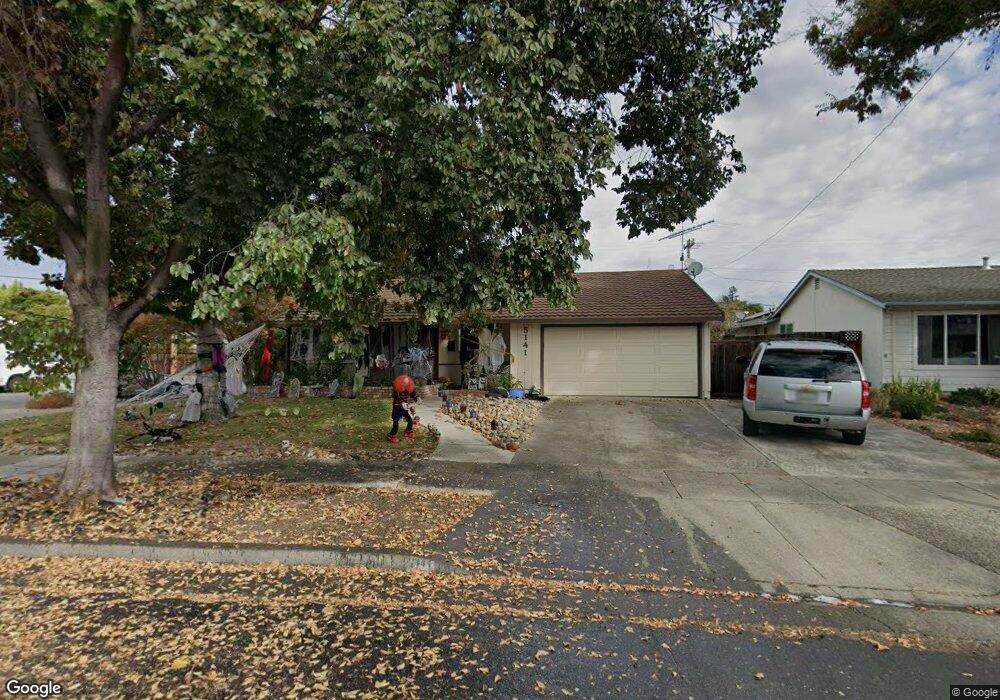
5141 Bela Dr San Jose, CA 95129
Country Lane NeighborhoodEstimated Value: $2,305,000 - $2,635,000
4
Beds
2
Baths
1,585
Sq Ft
$1,587/Sq Ft
Est. Value
About This Home
This home is located at 5141 Bela Dr, San Jose, CA 95129 and is currently estimated at $2,515,952, approximately $1,587 per square foot. 5141 Bela Dr is a home located in Santa Clara County with nearby schools including Country Lane Elementary School, Moreland Middle School, and Prospect High School.
Ownership History
Date
Name
Owned For
Owner Type
Purchase Details
Closed on
Jul 14, 2021
Sold by
Konkimalla Prashanth Kumar and Darbarwar Sunita
Bought by
Konkimalla Prashanth Kumar and Darbawar Sunita
Current Estimated Value
Purchase Details
Closed on
Dec 17, 2011
Sold by
Konkimalla Prashanth Kumar and Darbarwar Sunita
Bought by
Konkimalla Prashanth Kumar and Darbarwar Sunita
Purchase Details
Closed on
Dec 8, 2007
Sold by
Kuhlman Steven and Spratling Michele
Bought by
Konkimalla Prashanth K and Darbarwar Sunita
Home Financials for this Owner
Home Financials are based on the most recent Mortgage that was taken out on this home.
Original Mortgage
$720,000
Outstanding Balance
$454,787
Interest Rate
6.26%
Mortgage Type
Purchase Money Mortgage
Estimated Equity
$2,061,165
Purchase Details
Closed on
Apr 7, 2000
Sold by
Kuhlman Frederick M
Bought by
Equ Kuhlman Frederick M and Equ Luella E Kuhlman Exemption
Purchase Details
Closed on
Nov 4, 1994
Sold by
Kuhlman Frederick Michael and Kuhlman Luella E
Bought by
Kuhlman Frederick M and Kuhlman Luella E
Create a Home Valuation Report for This Property
The Home Valuation Report is an in-depth analysis detailing your home's value as well as a comparison with similar homes in the area
Home Values in the Area
Average Home Value in this Area
Purchase History
| Date | Buyer | Sale Price | Title Company |
|---|---|---|---|
| Konkimalla Prashanth Kumar | -- | None Available | |
| Konkimalla Prashanth Kumar | -- | None Available | |
| Konkimalla Prashanth Kumar | -- | None Available | |
| Konkimalla Prashanth K | $900,000 | Financial Title Company | |
| Equ Kuhlman Frederick M | -- | -- | |
| Kuhlman Frederick M | -- | -- |
Source: Public Records
Mortgage History
| Date | Status | Borrower | Loan Amount |
|---|---|---|---|
| Open | Konkimalla Prashanth K | $720,000 |
Source: Public Records
Tax History Compared to Growth
Tax History
| Year | Tax Paid | Tax Assessment Tax Assessment Total Assessment is a certain percentage of the fair market value that is determined by local assessors to be the total taxable value of land and additions on the property. | Land | Improvement |
|---|---|---|---|---|
| 2025 | $16,126 | $1,182,151 | $656,753 | $525,398 |
| 2024 | $16,126 | $1,158,973 | $643,876 | $515,097 |
| 2023 | $15,919 | $1,136,249 | $631,251 | $504,998 |
| 2022 | $15,673 | $1,113,971 | $618,874 | $495,097 |
| 2021 | $15,409 | $1,092,130 | $606,740 | $485,390 |
| 2020 | $15,106 | $1,080,932 | $600,519 | $480,413 |
| 2019 | $14,565 | $1,059,739 | $588,745 | $470,994 |
| 2018 | $14,215 | $1,038,960 | $577,201 | $461,759 |
| 2017 | $14,048 | $1,018,589 | $565,884 | $452,705 |
| 2016 | $13,326 | $998,618 | $554,789 | $443,829 |
| 2015 | $13,228 | $983,619 | $546,456 | $437,163 |
| 2014 | $12,529 | $964,352 | $535,752 | $428,600 |
Source: Public Records
Map
Nearby Homes
- 1367 Cordelia Ave
- 1510 Greene Dr
- 1370 Saratoga Ave
- 1364 Saratoga Ave
- 1092 Del Cambre Dr
- 5043 Le Miccine Terrace Unit 76
- 4640 Venice Way
- 1281 Saratoga Ave
- 1577 Maurice Ln
- 4478 Colombo Dr
- 5635 W Walbrook Dr
- 4694 Strawberry Park Dr
- 4470 Borina Dr
- 1092 Strayer Dr
- 1957 Colusa Way
- 5887 Amapola Dr
- 4108 Will Rogers Dr
- 12140 Woodside Dr
- 18980 Newsom Ave
- 4765 Elmhurst Dr
- 5127 Bela Dr
- 5098 Englewood Dr
- 5115 Bela Dr
- 5080 Englewood Dr
- 5153 Bela Dr
- 5102 Englewood Dr
- 5062 Englewood Dr
- 5142 Bela Dr
- 5128 Bela Dr
- 5101 Bela Dr
- 5116 Bela Dr
- 5114 Englewood Dr
- 5154 Bela Dr
- 5102 Bela Dr
- 5089 Bela Dr
- 1296 Brenton Ave
- 5126 Englewood Dr
- 5143 Rhonda Dr
- 5020 Englewood Dr
- 5129 Rhonda Dr