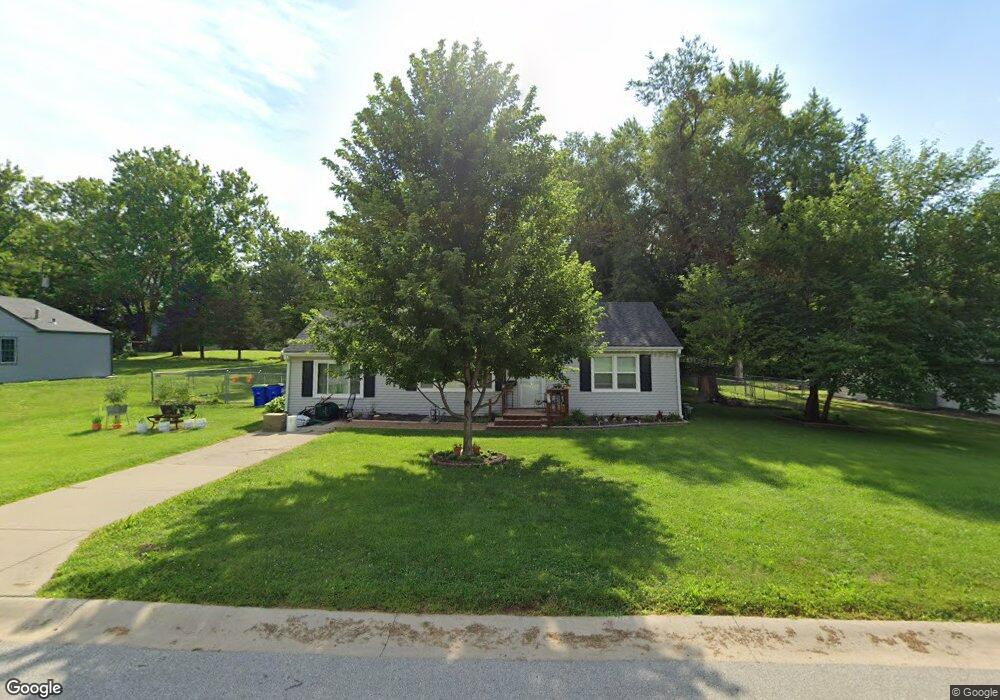
5141 Charles St Shawnee, KS 66216
Estimated Value: $262,000 - $280,000
3
Beds
1
Bath
1,176
Sq Ft
$230/Sq Ft
Est. Value
About This Home
This home is located at 5141 Charles St, Shawnee, KS 66216 and is currently estimated at $270,985, approximately $230 per square foot. 5141 Charles St is a home located in Johnson County with nearby schools including Ray Marsh Elementary School, Trailridge Middle School, and Shawnee Mission Northwest High School.
Ownership History
Date
Name
Owned For
Owner Type
Purchase Details
Closed on
Jun 30, 2011
Sold by
House Jonathon K
Bought by
Arnold Richard D
Current Estimated Value
Home Financials for this Owner
Home Financials are based on the most recent Mortgage that was taken out on this home.
Original Mortgage
$99,901
Outstanding Balance
$68,967
Interest Rate
4.66%
Mortgage Type
FHA
Estimated Equity
$202,018
Purchase Details
Closed on
Apr 1, 2011
Sold by
Secretary Of Veterans Affairs
Bought by
House Jonathon K
Purchase Details
Closed on
Dec 20, 2010
Sold by
Loomis Harold G and Loomis Me
Bought by
Secretary Of Veterans Affairs
Purchase Details
Closed on
Mar 25, 2002
Sold by
Banks Donald W and Banks Marilyn
Bought by
Loomis Harold G and Loomis Me Ran
Home Financials for this Owner
Home Financials are based on the most recent Mortgage that was taken out on this home.
Original Mortgage
$114,240
Interest Rate
6.83%
Mortgage Type
VA
Create a Home Valuation Report for This Property
The Home Valuation Report is an in-depth analysis detailing your home's value as well as a comparison with similar homes in the area
Home Values in the Area
Average Home Value in this Area
Purchase History
| Date | Buyer | Sale Price | Title Company |
|---|---|---|---|
| Arnold Richard D | -- | First United Title Agency | |
| House Jonathon K | -- | First United Title Agency | |
| Secretary Of Veterans Affairs | $87,249 | First United Title Agency | |
| Loomis Harold G | -- | Columbian National Title Ins |
Source: Public Records
Mortgage History
| Date | Status | Borrower | Loan Amount |
|---|---|---|---|
| Open | Arnold Richard D | $99,901 | |
| Previous Owner | Loomis Harold G | $114,240 |
Source: Public Records
Tax History Compared to Growth
Tax History
| Year | Tax Paid | Tax Assessment Tax Assessment Total Assessment is a certain percentage of the fair market value that is determined by local assessors to be the total taxable value of land and additions on the property. | Land | Improvement |
|---|---|---|---|---|
| 2024 | $2,724 | $26,071 | $6,529 | $19,542 |
| 2023 | $2,701 | $25,266 | $5,934 | $19,332 |
| 2022 | $2,412 | $22,482 | $5,390 | $17,092 |
| 2021 | $2,405 | $20,895 | $4,687 | $16,208 |
| 2020 | $2,388 | $20,481 | $4,263 | $16,218 |
| 2019 | $2,022 | $17,296 | $4,064 | $13,232 |
| 2018 | $1,976 | $16,836 | $4,064 | $12,772 |
| 2017 | $1,724 | $14,433 | $3,694 | $10,739 |
| 2016 | $1,593 | $13,156 | $3,694 | $9,462 |
| 2015 | $1,449 | $12,558 | $3,694 | $8,864 |
| 2013 | -- | $11,569 | $3,694 | $7,875 |
Source: Public Records
Map
Nearby Homes
- 13126 W 52nd Terrace
- 13134 W 52nd Terrace
- 13130 W 52nd Terrace
- 11815 W 53rd St
- 5407 Halsey St
- 5504 Monrovia St
- 11907 W 49th Place
- 11403 W 51st Terrace
- 13305 W 51st St
- 12508 W 56th St
- 12023 W 48th St
- 14170 W 49th St
- 5021 Bradshaw St
- 5013 Bradshaw St
- 5308 Mcanany Dr
- W 48th St
- 5507 Noland Rd
- 12809 W 57th Terrace
- 5845 Caenen St
- 11002 W 55th Terrace
- 5131 Charles St
- 5140 Halsey St
- 5130 Halsey St
- 5150 Halsey St
- 5140 Charles St
- 5121 Charles St
- 5161 Charles St
- 5150 Charles St
- 5130 Charles St
- 5120 Halsey St
- 5160 Halsey St
- 5160 Charles St
- 5120 Charles St
- 5111 Charles St
- 5141 Monrovia St
- 5135 Halsey St
- 5131 Monrovia St
- 5151 Monrovia St
- 5110 Halsey St
- 5110 Charles St