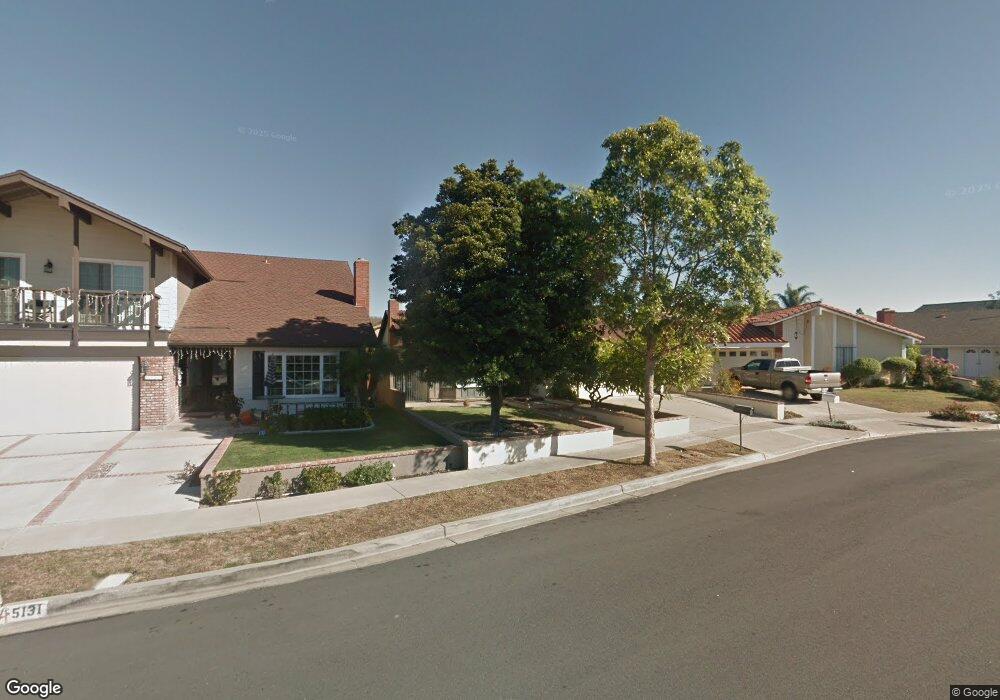
5141 Greencap Ave Irvine, CA 92604
Walnut NeighborhoodEstimated Value: $1,165,092 - $1,342,000
2
Beds
1
Bath
1,237
Sq Ft
$998/Sq Ft
Est. Value
About This Home
This home is located at 5141 Greencap Ave, Irvine, CA 92604 and is currently estimated at $1,234,773, approximately $998 per square foot. 5141 Greencap Ave is a home located in Orange County with nearby schools including Greentree Elementary School, Venado Middle School, and Irvine High School.
Ownership History
Date
Name
Owned For
Owner Type
Purchase Details
Closed on
Jun 21, 2024
Sold by
Brennan Diane Carol and Brennan Diane C
Bought by
Diane C Brennan Family Trust and Brennan
Current Estimated Value
Purchase Details
Closed on
Dec 22, 2022
Sold by
Messina Family Trust and Brennan Diane Carol
Bought by
Brennan Diane Carol
Purchase Details
Closed on
Oct 26, 1999
Sold by
Messina Ben J and Messina Joan C
Bought by
Messina Ben J and Messina Joan C
Purchase Details
Closed on
Apr 10, 1998
Sold by
Brigitte Laurent and Brigitte Rene
Bought by
Messina Ben and Messina Joan
Home Financials for this Owner
Home Financials are based on the most recent Mortgage that was taken out on this home.
Original Mortgage
$139,000
Interest Rate
7.05%
Purchase Details
Closed on
Nov 15, 1993
Sold by
Laurent Rene and Laurent Monique
Bought by
Laurent Rene and Laurent Monique
Home Financials for this Owner
Home Financials are based on the most recent Mortgage that was taken out on this home.
Original Mortgage
$85,000
Interest Rate
6.88%
Create a Home Valuation Report for This Property
The Home Valuation Report is an in-depth analysis detailing your home's value as well as a comparison with similar homes in the area
Home Values in the Area
Average Home Value in this Area
Purchase History
| Date | Buyer | Sale Price | Title Company |
|---|---|---|---|
| Diane C Brennan Family Trust | -- | None Listed On Document | |
| Brennan Diane Carol | -- | None Listed On Document | |
| Brennan Diane Carol | -- | None Listed On Document | |
| Messina Ben J | -- | -- | |
| Messina Ben | $214,000 | First Southwestern Title Co | |
| Laurent Rene | -- | Gateway Title Company |
Source: Public Records
Mortgage History
| Date | Status | Borrower | Loan Amount |
|---|---|---|---|
| Previous Owner | Messina Ben | $139,000 | |
| Previous Owner | Laurent Rene | $85,000 |
Source: Public Records
Tax History
| Year | Tax Paid | Tax Assessment Tax Assessment Total Assessment is a certain percentage of the fair market value that is determined by local assessors to be the total taxable value of land and additions on the property. | Land | Improvement |
|---|---|---|---|---|
| 2025 | $3,617 | $341,692 | $242,601 | $99,091 |
| 2024 | $3,617 | $334,993 | $237,844 | $97,149 |
| 2023 | $3,522 | $328,425 | $233,180 | $95,245 |
| 2022 | $3,449 | $321,986 | $228,608 | $93,378 |
| 2021 | $3,366 | $315,673 | $224,125 | $91,548 |
| 2020 | $3,347 | $312,437 | $221,827 | $90,610 |
| 2019 | $3,271 | $306,311 | $217,477 | $88,834 |
| 2018 | $3,283 | $300,305 | $213,212 | $87,093 |
| 2017 | $3,143 | $294,417 | $209,031 | $85,386 |
| 2016 | $3,006 | $288,645 | $204,933 | $83,712 |
| 2015 | $2,961 | $284,310 | $201,855 | $82,455 |
| 2014 | $2,904 | $278,741 | $197,901 | $80,840 |
Source: Public Records
Map
Nearby Homes
- 14851 Jeffrey Rd Unit 248
- 14851 Jeffrey Rd Unit 69
- 14851 Jeffrey Rd Unit 61
- 14851 Jeffrey Rd Unit 192
- 14851 Jeffrey Rd Unit 241
- 14851 Jeffrey Rd Unit 145
- 14851 Jeffrey Rd Unit 246
- 14851 Jeffrey Rd Unit 7
- 14851 Jeffrey Rd Unit 326
- 14851 Jeffrey Rd Unit 117
- 14851 Jeffrey Rd Unit 38
- 14851 Jeffrey Rd Unit 199
- 45 Golden Glen St Unit 75
- 54 Kazan St
- 16 Oval Rd
- 4862 Gainsport Cir
- 14921 Pinehaven Rd
- 10 Raleigh
- 26 Helena Unit 69
- 5 Locust
- 5131 Greencap Ave
- 5151 Greencap Ave
- 5132 Doanoke Ave
- 5121 Greencap Ave
- 5142 Doanoke Ave
- 5122 Doanoke Ave
- 5161 Greencap Ave
- 5152 Doanoke Ave
- 5112 Doanoke Ave
- 5111 Greencap Ave
- 14812 Rattan St
- 5132 Greencap Ave
- 5162 Doanoke Ave
- 5122 Greencap Ave
- 5102 Doanoke Ave
- 14822 Rattan St
- 5101 Greencap Ave
- 5112 Greencap Ave
- 5172 Doanoke Ave
- 14791 Dahlquist Rd
Your Personal Tour Guide
Ask me questions while you tour the home.