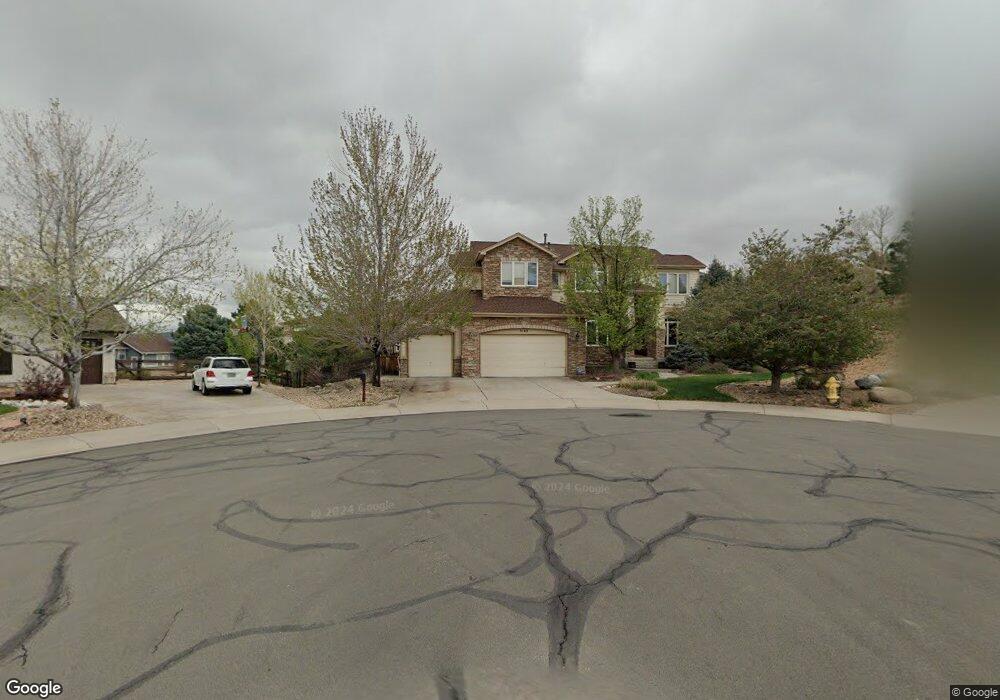
5142 Blue Jay Cir Castle Rock, CO 80109
The Meadows NeighborhoodEstimated Value: $1,004,000 - $1,174,000
5
Beds
5
Baths
3,812
Sq Ft
$291/Sq Ft
Est. Value
About This Home
This home is located at 5142 Blue Jay Cir, Castle Rock, CO 80109 and is currently estimated at $1,108,865, approximately $290 per square foot. 5142 Blue Jay Cir is a home located in Douglas County with nearby schools including Soaring Hawk Elementary School, Castle Rock Middle School, and Castle View High School.
Ownership History
Date
Name
Owned For
Owner Type
Purchase Details
Closed on
Sep 13, 2002
Sold by
Waterford Equities Inc
Bought by
Davis Paul A and Davis Terri J
Current Estimated Value
Home Financials for this Owner
Home Financials are based on the most recent Mortgage that was taken out on this home.
Original Mortgage
$275,000
Outstanding Balance
$116,301
Interest Rate
6.41%
Estimated Equity
$992,564
Purchase Details
Closed on
Jan 31, 2002
Sold by
Engle Homes/Colorado Inc
Bought by
Waterford Equities Inc
Purchase Details
Closed on
Jan 17, 2002
Sold by
Colorado Soaring Eagle Llc
Bought by
Engle Homes Colorado Inc
Purchase Details
Closed on
Mar 18, 1994
Sold by
Mf6 Inc Fka Management Resources Inc
Bought by
Mf6 Inc
Purchase Details
Closed on
Dec 31, 1993
Sold by
Yale Inv Inc
Bought by
Investors Affiliated Mtg Inc
Purchase Details
Closed on
Mar 5, 1993
Sold by
Castle Meadows Inc
Bought by
Yale Inv Inc
Create a Home Valuation Report for This Property
The Home Valuation Report is an in-depth analysis detailing your home's value as well as a comparison with similar homes in the area
Home Values in the Area
Average Home Value in this Area
Purchase History
| Date | Buyer | Sale Price | Title Company |
|---|---|---|---|
| Davis Paul A | $643,248 | Land Title | |
| Waterford Equities Inc | $80,000 | Universal Land Title Of Co I | |
| Engle Homes Colorado Inc | $825,000 | -- | |
| Mf6 Inc | -- | -- | |
| Investors Affiliated Mtg Inc | -- | -- | |
| Management Resources Inc | $5,251,500 | -- | |
| Investors Affiliated Mortgage Inc | -- | -- | |
| Yale Inv Inc | -- | -- |
Source: Public Records
Mortgage History
| Date | Status | Borrower | Loan Amount |
|---|---|---|---|
| Open | Davis Paul A | $275,000 |
Source: Public Records
Tax History Compared to Growth
Tax History
| Year | Tax Paid | Tax Assessment Tax Assessment Total Assessment is a certain percentage of the fair market value that is determined by local assessors to be the total taxable value of land and additions on the property. | Land | Improvement |
|---|---|---|---|---|
| 2024 | $7,757 | $78,070 | $18,460 | $59,610 |
| 2023 | $7,829 | $78,070 | $18,460 | $59,610 |
| 2022 | $5,170 | $50,870 | $12,240 | $38,630 |
| 2021 | $5,370 | $50,870 | $12,240 | $38,630 |
| 2020 | $5,179 | $50,230 | $12,260 | $37,970 |
| 2019 | $5,197 | $50,230 | $12,260 | $37,970 |
| 2018 | $4,898 | $46,550 | $9,310 | $37,240 |
| 2017 | $4,621 | $46,550 | $9,310 | $37,240 |
| 2016 | $4,520 | $44,760 | $7,250 | $37,510 |
| 2015 | $4,605 | $44,760 | $7,250 | $37,510 |
| 2014 | $5,186 | $47,590 | $5,570 | $42,020 |
Source: Public Records
Map
Nearby Homes
- 4985 Bear Paw Dr
- 3443 Elk Run Dr
- 3438 Elk Run Dr
- 3266 Coyote Hills Way
- 3348 Elk Run Dr
- 3644 Sunridge Terrace Dr
- 3066 Craig Ct
- 3048 Starling Ct
- 2980 Craig Ct
- 4731 Sunridge Terrace Dr
- 3016 Breezy Ln
- 4599 Sunridge Terrace Dr
- 3389 Willowrun Dr
- 2877 Craig Ct
- 3355 Willowrun Dr
- 3445 Springbriar Dr
- 2934 Feather Ct
- 3797 Windriver Trail
- 2880 Breezy Ln
- 2872 Feather Ct
- 3778 Sky Hawk Ct
- 5168 Blue Jay Cir
- 5185 Blue Jay Cir
- 3673 Soaring Eagle Ct
- 3703 Soaring Eagle Ct
- 3785 Sky Hawk Ct
- 3733 Soaring Eagle Ct
- 3653 Soaring Eagle Ct
- 3794 Sky Hawk Ct
- 5203 Blue Jay Cir
- 3732 Running Deer Dr
- 3623 Soaring Eagle Ct
- 3776 Running Deer Dr
- 3753 Soaring Eagle Ct
- 3814 Sky Hawk Ct
- 3813 Sky Hawk Ct
- 3808 Running Deer Dr
- 3694 Soaring Eagle Ct
- 3664 Soaring Eagle Ct
- 3708 Soaring Eagle Ct