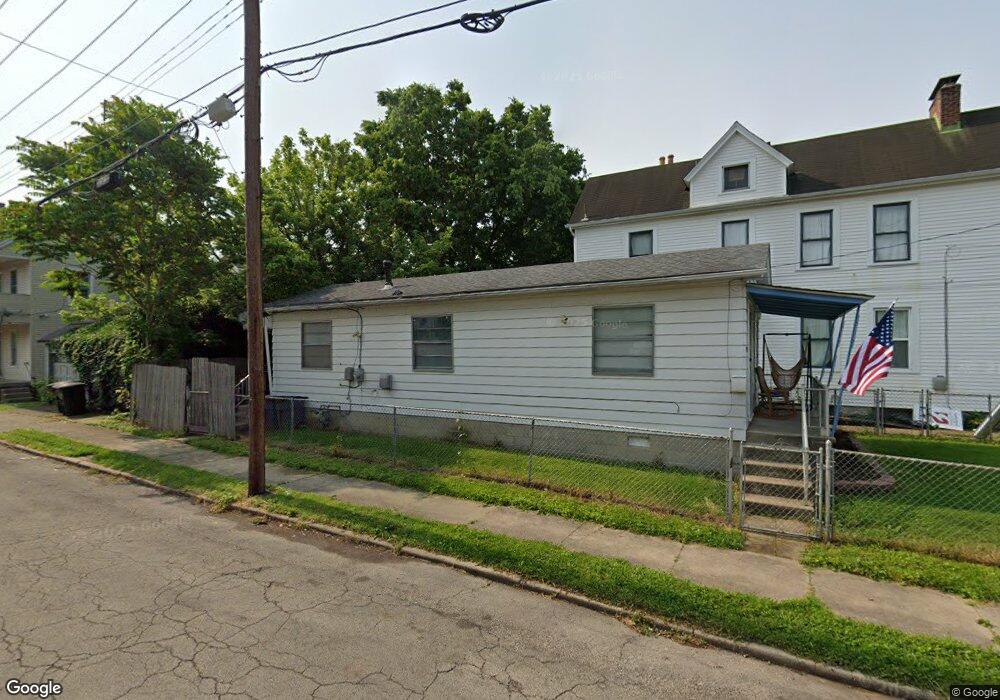
5142 Rolston Ave Cincinnati, OH 45212
Estimated Value: $108,000 - $166,000
1
Bed
1
Bath
680
Sq Ft
$183/Sq Ft
Est. Value
About This Home
This home is located at 5142 Rolston Ave, Cincinnati, OH 45212 and is currently estimated at $124,628, approximately $183 per square foot. 5142 Rolston Ave is a home located in Hamilton County with nearby schools including Norwood High School, Cornerstone Christian Academy, and Immaculate Conception Academy.
Ownership History
Date
Name
Owned For
Owner Type
Purchase Details
Closed on
Mar 13, 2019
Sold by
Sullivan Molly E
Bought by
5142 Rolston Llc
Current Estimated Value
Purchase Details
Closed on
Dec 21, 2017
Sold by
Ampleman Alex E
Bought by
Sullivan Molly E
Purchase Details
Closed on
Apr 20, 2015
Sold by
In The Box Llc
Bought by
Ampleman Alex E
Home Financials for this Owner
Home Financials are based on the most recent Mortgage that was taken out on this home.
Original Mortgage
$23,750
Interest Rate
3.85%
Mortgage Type
New Conventional
Purchase Details
Closed on
Apr 25, 2014
Sold by
Ashby Todd P
Bought by
The Box Llc
Purchase Details
Closed on
Apr 22, 2014
Sold by
Gibson Mona F
Bought by
Ashby Todd P
Create a Home Valuation Report for This Property
The Home Valuation Report is an in-depth analysis detailing your home's value as well as a comparison with similar homes in the area
Home Values in the Area
Average Home Value in this Area
Purchase History
| Date | Buyer | Sale Price | Title Company |
|---|---|---|---|
| 5142 Rolston Llc | -- | None Available | |
| Sullivan Molly E | $16,200 | None Available | |
| Ampleman Alex E | $26,000 | Hallmark Title | |
| The Box Llc | -- | Stewart Title Company | |
| Ashby Todd P | $16,015 | Stewart Title Company |
Source: Public Records
Mortgage History
| Date | Status | Borrower | Loan Amount |
|---|---|---|---|
| Previous Owner | Ampleman Alex E | $23,750 |
Source: Public Records
Tax History
| Year | Tax Paid | Tax Assessment Tax Assessment Total Assessment is a certain percentage of the fair market value that is determined by local assessors to be the total taxable value of land and additions on the property. | Land | Improvement |
|---|---|---|---|---|
| 2025 | $1,251 | $23,304 | $6,913 | $16,391 |
| 2023 | $1,258 | $23,304 | $6,913 | $16,391 |
| 2022 | $373 | $5,671 | $5,240 | $431 |
| 2021 | $358 | $5,671 | $5,240 | $431 |
| 2020 | $350 | $5,671 | $5,240 | $431 |
| 2019 | $991 | $14,718 | $4,596 | $10,122 |
| 2018 | $992 | $14,718 | $4,596 | $10,122 |
| 2017 | $954 | $14,718 | $4,596 | $10,122 |
| 2016 | $383 | $5,605 | $4,319 | $1,286 |
| 2015 | $385 | $5,605 | $4,319 | $1,286 |
| 2014 | $322 | $5,605 | $4,319 | $1,286 |
| 2013 | $951 | $16,990 | $4,596 | $12,394 |
Source: Public Records
Map
Nearby Homes
- 5121 Rolston Ave
- 5203 Rolston Ave
- 5123 Globe Ave
- 5126 Globe Ave
- 1945 Lawn Ave
- 2106 Lawn Ave
- 5234 Hunter Ave
- 5255 Rolston Ave
- 5258 Hunter Ave
- 2134 Ross Ave
- 5314 Section Ave
- 5310 Globe Ave
- 1966 Avonlea Ave
- 1832 Catalina Ave
- 2005 Crown Ave
- 2229 Feldman Ave
- 1907 Crown Ave
- 2323 Sherwood Ln
- 1952 Maple Ave
- 5033 Wesley Ave
- 5140 Rolston Ave
- 5138 Rolston Ave
- 5136 Rolston Ave
- 5200 Rolston Ave
- 5143 Hunter Ave
- 5132 Rolston Ave
- 5135 Hunter Ave
- 5137 Hunter Ave
- 5145 Hunter Ave
- 5204 Rolston Ave
- 5206 Rolston Ave
- 5130 Rolston Ave
- 5201 Hunter Ave Unit 3
- 5201 Hunter Ave Unit 4
- 5201 Hunter Ave
- 5203 Hunter Ave
- 5143 Rolston Ave
- 5141 Rolston Ave
- 5205 Hunter Ave
- 5133 Hunter Ave
Your Personal Tour Guide
Ask me questions while you tour the home.