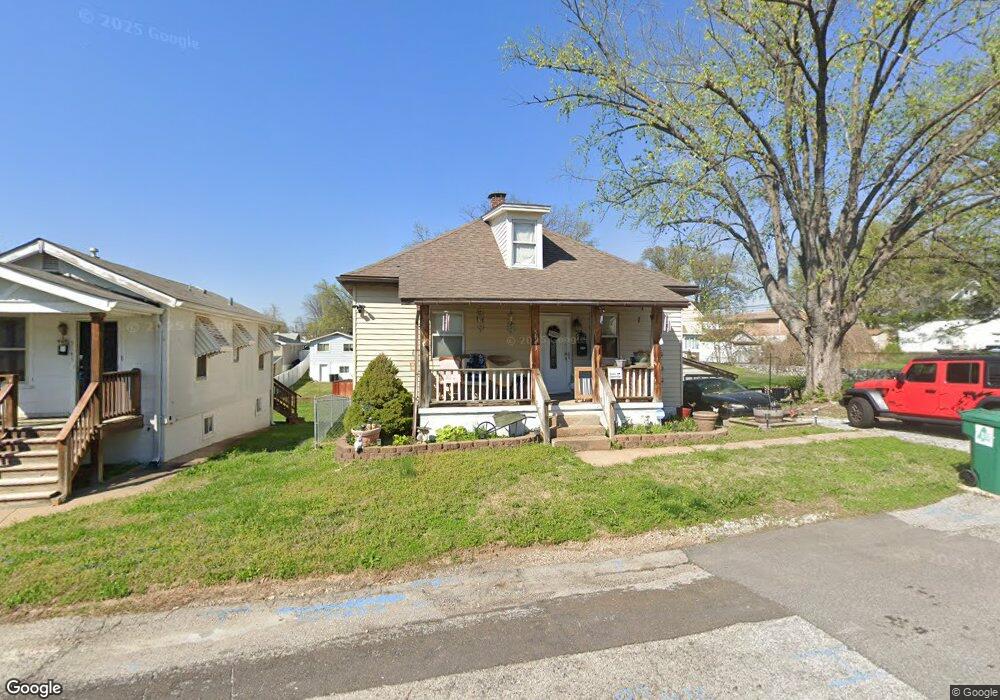
5143 Waldo Ave Saint Louis, MO 63123
Estimated Value: $180,000 - $236,000
3
Beds
1
Bath
1,217
Sq Ft
$164/Sq Ft
Est. Value
About This Home
This home is located at 5143 Waldo Ave, Saint Louis, MO 63123 and is currently estimated at $199,513, approximately $163 per square foot. 5143 Waldo Ave is a home located in St. Louis County with nearby schools including Bayless Elementary School, Bayless Junior High School, and Bayless Senior High School.
Ownership History
Date
Name
Owned For
Owner Type
Purchase Details
Closed on
Nov 6, 2010
Sold by
Mcpherson Christine
Bought by
Mcpherson Scott
Current Estimated Value
Purchase Details
Closed on
Oct 26, 2005
Sold by
Mcpherson Scott and Mcpherson Christine
Bought by
Mcpherson Scott and Mcpherson Christine
Home Financials for this Owner
Home Financials are based on the most recent Mortgage that was taken out on this home.
Original Mortgage
$109,600
Outstanding Balance
$66,199
Interest Rate
7.87%
Mortgage Type
New Conventional
Estimated Equity
$133,314
Purchase Details
Closed on
May 25, 1999
Sold by
Berry Karon M and Harfst Richard
Bought by
Mcpherson Scott
Home Financials for this Owner
Home Financials are based on the most recent Mortgage that was taken out on this home.
Original Mortgage
$88,241
Interest Rate
6.91%
Create a Home Valuation Report for This Property
The Home Valuation Report is an in-depth analysis detailing your home's value as well as a comparison with similar homes in the area
Home Values in the Area
Average Home Value in this Area
Purchase History
| Date | Buyer | Sale Price | Title Company |
|---|---|---|---|
| Mcpherson Scott | -- | Enterprise Title Llc | |
| Mcpherson Scott | -- | Enterprise Title Llc | |
| Mcpherson Scott | $89,000 | -- |
Source: Public Records
Mortgage History
| Date | Status | Borrower | Loan Amount |
|---|---|---|---|
| Open | Mcpherson Scott | $109,600 | |
| Closed | Mcpherson Scott | $88,241 |
Source: Public Records
Tax History Compared to Growth
Tax History
| Year | Tax Paid | Tax Assessment Tax Assessment Total Assessment is a certain percentage of the fair market value that is determined by local assessors to be the total taxable value of land and additions on the property. | Land | Improvement |
|---|---|---|---|---|
| 2025 | $2,230 | $35,630 | $15,810 | $19,820 |
| 2024 | $2,230 | $30,820 | $9,030 | $21,790 |
| 2023 | $2,230 | $30,820 | $9,030 | $21,790 |
| 2022 | $1,945 | $24,650 | $9,030 | $15,620 |
| 2021 | $1,895 | $24,650 | $9,030 | $15,620 |
| 2020 | $1,881 | $22,670 | $8,320 | $14,350 |
| 2019 | $1,877 | $22,670 | $8,320 | $14,350 |
| 2018 | $1,642 | $17,550 | $7,180 | $10,370 |
| 2017 | $1,542 | $17,550 | $7,180 | $10,370 |
| 2016 | $1,516 | $16,970 | $3,190 | $13,780 |
| 2015 | $1,524 | $16,970 | $3,190 | $13,780 |
| 2014 | $1,406 | $15,600 | $5,740 | $9,860 |
Source: Public Records
Map
Nearby Homes
- 5122 Hilda Ave
- 5114 Heege Rd
- 8515 Philo Ave
- 5331 Vine Ave
- 5309 Staely Ave
- 5237 Heege Rd
- 8506 Mathilda Ave
- 8550 Pilot Ave
- 8034 Genesta St
- 8009 Gravois Rd
- 5515 Maxwell Ave
- 5615 Willard Ave
- 4955 Seibert Ave
- 7910 Gravois Rd
- 5800 Langley Ave
- 7908 Fleta St
- 8032 Joel Ave
- 8022 Joel Ave
- 8029 Joel Ave
- 8348 Vasel Dr