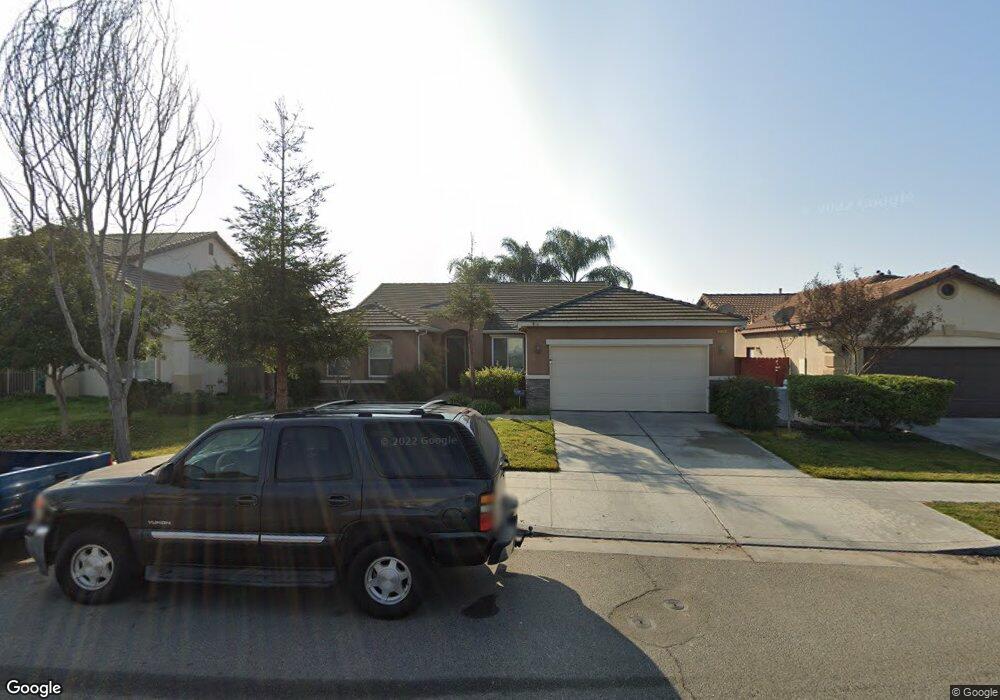
5144 E Lowe Ave Fresno, CA 93727
Sunnyside NeighborhoodEstimated Value: $414,610 - $423,000
3
Beds
2
Baths
1,812
Sq Ft
$231/Sq Ft
Est. Value
About This Home
This home is located at 5144 E Lowe Ave, Fresno, CA 93727 and is currently estimated at $418,870, approximately $231 per square foot. 5144 E Lowe Ave is a home located in Fresno County with nearby schools including Ayer Elementary School, Elizabeth Terronez Middle School, and Sunnyside High School.
Ownership History
Date
Name
Owned For
Owner Type
Purchase Details
Closed on
Dec 7, 2020
Sold by
Flue Michael Scott Von and Flue Cynthia Darlene
Bought by
Flue Michael Scott Von and Flue Cynthia Darlene
Current Estimated Value
Home Financials for this Owner
Home Financials are based on the most recent Mortgage that was taken out on this home.
Original Mortgage
$169,000
Outstanding Balance
$149,007
Interest Rate
2.8%
Mortgage Type
New Conventional
Estimated Equity
$269,863
Purchase Details
Closed on
Jun 15, 2012
Sold by
Shanoian Lisa
Bought by
Vonflue Michael S and Von Flue Cynthia D
Home Financials for this Owner
Home Financials are based on the most recent Mortgage that was taken out on this home.
Original Mortgage
$135,500
Interest Rate
3.31%
Mortgage Type
FHA
Purchase Details
Closed on
Aug 20, 2008
Sold by
Mcmillin Rustic Oaks Llc
Bought by
Shanoian Lisa
Home Financials for this Owner
Home Financials are based on the most recent Mortgage that was taken out on this home.
Original Mortgage
$198,645
Interest Rate
6.51%
Mortgage Type
FHA
Create a Home Valuation Report for This Property
The Home Valuation Report is an in-depth analysis detailing your home's value as well as a comparison with similar homes in the area
Home Values in the Area
Average Home Value in this Area
Purchase History
| Date | Buyer | Sale Price | Title Company |
|---|---|---|---|
| Flue Michael Scott Von | -- | Fidelity National Title Co | |
| Vonflue Michael S | $138,000 | Placer Title Company | |
| Shanoian Lisa | $207,000 | First American Title |
Source: Public Records
Mortgage History
| Date | Status | Borrower | Loan Amount |
|---|---|---|---|
| Open | Flue Michael Scott Von | $169,000 | |
| Previous Owner | Vonflue Michael S | $135,500 | |
| Previous Owner | Shanoian Lisa | $198,645 |
Source: Public Records
Tax History
| Year | Tax Paid | Tax Assessment Tax Assessment Total Assessment is a certain percentage of the fair market value that is determined by local assessors to be the total taxable value of land and additions on the property. | Land | Improvement |
|---|---|---|---|---|
| 2025 | $2,538 | $169,927 | $61,567 | $108,360 |
| 2023 | $2,297 | $163,330 | $59,177 | $104,153 |
| 2022 | $2,261 | $160,128 | $58,017 | $102,111 |
| 2021 | $2,192 | $156,989 | $56,880 | $100,109 |
| 2020 | $2,114 | $155,380 | $56,297 | $99,083 |
| 2019 | $2,183 | $152,335 | $55,194 | $97,141 |
| 2018 | $2,075 | $149,349 | $54,112 | $95,237 |
| 2017 | $1,929 | $146,421 | $53,051 | $93,370 |
| 2016 | $1,880 | $143,551 | $52,011 | $91,540 |
| 2015 | $1,966 | $141,395 | $51,230 | $90,165 |
| 2014 | $1,961 | $138,626 | $50,227 | $88,399 |
Source: Public Records
Map
Nearby Homes
- 5145 E Lane Ave Unit 252
- 1691 S Bailey Ave
- 2194 S Sylmar Ave
- 4985 E Butler Ave Unit 109
- 5167 E Balch Ave
- 4975 E Butler Ave Unit 103
- 5178 E Woodward Ave
- 5167 E Dwight Way
- 345 S Bailey Ave
- 4948 E Townsend Ave
- 240 S Bailey Ave
- 5121 E Audrie Ave
- 4860 E Lane Ave Unit 230
- 4860 E Lane Ave Unit 104
- 1190 S Winery Ave Unit 146
- 5454 E Butler Ave
- 2163 S Terry Ave
- 2149 S Cindy Ave
- 2171 S Terry Ave
- 2187 S Terry Ave
- 5154 E Lowe Ave
- 5134 E Lowe Ave
- 5145 E Benjamin Ave
- 5155 E Benjamin Ave
- 5135 E Benjamin Ave
- 5164 E Lowe Ave
- 5124 E Lowe Ave
- 5165 E Benjamin Ave
- 5125 E Benjamin Ave
- 5174 E Lowe Ave
- 5133 E Lowe Ave
- 5153 E Lowe Ave
- 5175 E Benjamin Ave
- 5123 E Lowe Ave
- 5163 E Lowe Ave
- 1225 S Bailey Ave
- 1235 S Bailey Ave
- 5184 E Lowe Ave
- 1245 S Bailey Ave
- 5113 E Lowe Ave
Your Personal Tour Guide
Ask me questions while you tour the home.