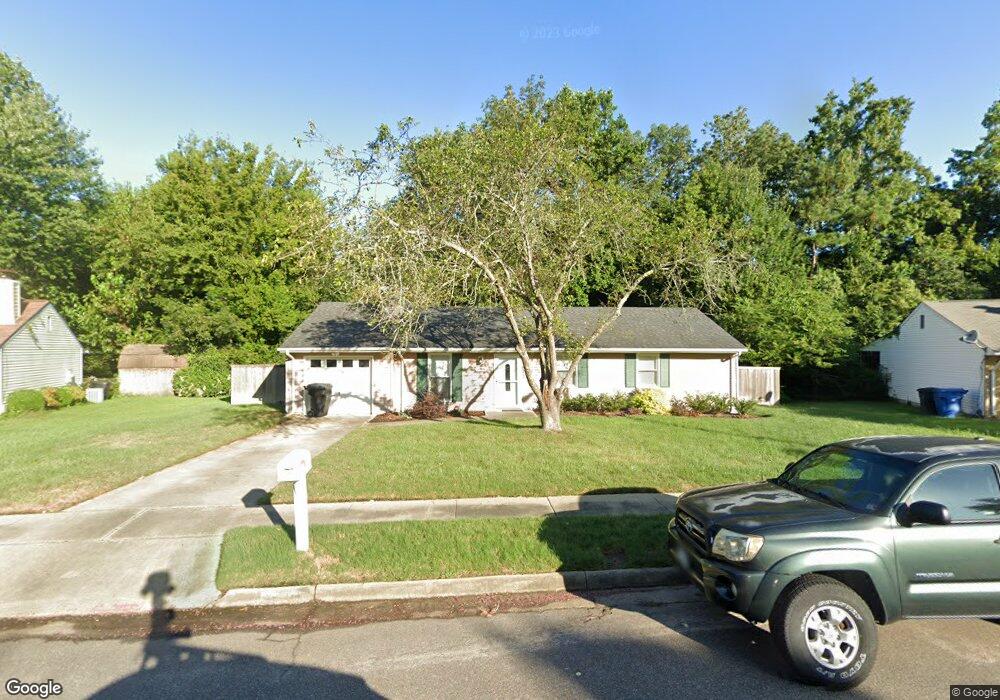
5144 Sammy St Virginia Beach, VA 23455
Bayside NeighborhoodEstimated Value: $299,000 - $359,282
3
Beds
2
Baths
1,505
Sq Ft
$219/Sq Ft
Est. Value
About This Home
This home is located at 5144 Sammy St, Virginia Beach, VA 23455 and is currently estimated at $329,071, approximately $218 per square foot. 5144 Sammy St is a home located in Virginia Beach City with nearby schools including Luxford Elementary School, Bayside 6th Grade Campus, and Bayside High School.
Ownership History
Date
Name
Owned For
Owner Type
Purchase Details
Closed on
Oct 1, 2015
Sold by
Brown Thomas
Bought by
Medford Jeffrey D
Current Estimated Value
Home Financials for this Owner
Home Financials are based on the most recent Mortgage that was taken out on this home.
Original Mortgage
$247,920
Interest Rate
3.79%
Mortgage Type
VA
Purchase Details
Closed on
Mar 5, 2015
Sold by
Deutsche Bank National Trust C
Bought by
Brown Thomas
Purchase Details
Closed on
Feb 2, 2015
Sold by
Professional Foreclosure Corp and Johnson William T
Bought by
Deutsche Bank National Trust C
Purchase Details
Closed on
Jul 10, 2002
Sold by
Howard Robert
Bought by
Johnson William
Home Financials for this Owner
Home Financials are based on the most recent Mortgage that was taken out on this home.
Original Mortgage
$94,350
Interest Rate
6.73%
Purchase Details
Closed on
Apr 23, 2002
Sold by
Slaughter Craig D
Bought by
Howard Robert W
Create a Home Valuation Report for This Property
The Home Valuation Report is an in-depth analysis detailing your home's value as well as a comparison with similar homes in the area
Home Values in the Area
Average Home Value in this Area
Purchase History
| Date | Buyer | Sale Price | Title Company |
|---|---|---|---|
| Medford Jeffrey D | $240,000 | Attorney | |
| Brown Thomas | $141,225 | -- | |
| Deutsche Bank National Trust C | $339,454 | -- | |
| Johnson William | $116,000 | -- | |
| Howard Robert W | $90,000 | -- |
Source: Public Records
Mortgage History
| Date | Status | Borrower | Loan Amount |
|---|---|---|---|
| Previous Owner | Medford Jeffrey D | $247,920 | |
| Previous Owner | Johnson William | $94,350 |
Source: Public Records
Tax History Compared to Growth
Tax History
| Year | Tax Paid | Tax Assessment Tax Assessment Total Assessment is a certain percentage of the fair market value that is determined by local assessors to be the total taxable value of land and additions on the property. | Land | Improvement |
|---|---|---|---|---|
| 2025 | $2,977 | $308,000 | $141,800 | $166,200 |
| 2024 | $2,977 | $306,900 | $141,800 | $165,100 |
| 2023 | $2,659 | $268,600 | $120,000 | $148,600 |
| 2022 | $2,393 | $241,700 | $112,000 | $129,700 |
| 2021 | $2,217 | $223,900 | $91,000 | $132,900 |
| 2020 | $2,244 | $220,500 | $91,000 | $129,500 |
| 2019 | $2,237 | $219,900 | $91,000 | $128,900 |
| 2018 | $2,205 | $219,900 | $91,000 | $128,900 |
| 2017 | $2,183 | $217,800 | $91,000 | $126,800 |
| 2016 | $2,051 | $207,200 | $90,200 | $117,000 |
| 2015 | $1,919 | $193,800 | $90,200 | $103,600 |
| 2014 | $1,798 | $193,300 | $96,000 | $97,300 |
Source: Public Records
Map
Nearby Homes
- 932 Southmoor Dr Unit 203
- 912 Southmoor Dr Unit 303
- 900 Southmoor Dr Unit 103
- 900 Southmoor Dr Unit 105
- 900 Southmoor Dr Unit 205
- 5024 Hawkins Mill Way
- 5113 Elsie Dr
- 1017 Farrcroft Way
- 5237 Elston Ln
- 5321 Warminster Dr Unit 302
- 5321 Warminster Dr Unit 306
- 5329 Warminster Dr Unit 202
- 5229 Ordsall Place
- 5057 Sullivan Blvd
- 740 Farnham Ln
- 5344 Charmont Ct
- 1133 Broadholme Place
- 769 Olivieri Ln
- 703 Oak Hurst Ct
- 5317 Brookstone Ln
- 5148 Sammy St
- 5140 Sammy St
- 5136 Sammy St
- 5133 Sammy St
- 5152 Sammy St
- 5137 Sammy St
- 924 Southmoor Dr Unit 306
- 924 Southmoor Dr Unit 305
- 924 Southmoor Dr Unit 206
- 924 Southmoor Dr Unit 205
- 924 Southmoor Dr Unit 105
- 924 Southmoor Dr Unit 304
- 924 Southmoor Dr Unit 204
- 924 Southmoor Dr Unit 203
- 924 Southmoor Dr Unit 104
- 924 Southmoor Dr Unit 103
- 924 Southmoor Dr Unit 302
- 924 Southmoor Dr Unit 301
- 924 Southmoor Dr Unit 202
- 924 Southmoor Dr Unit 201