Estimated Value: $129,728 - $163,000
Studio
1
Bath
961
Sq Ft
$145/Sq Ft
Est. Value
About This Home
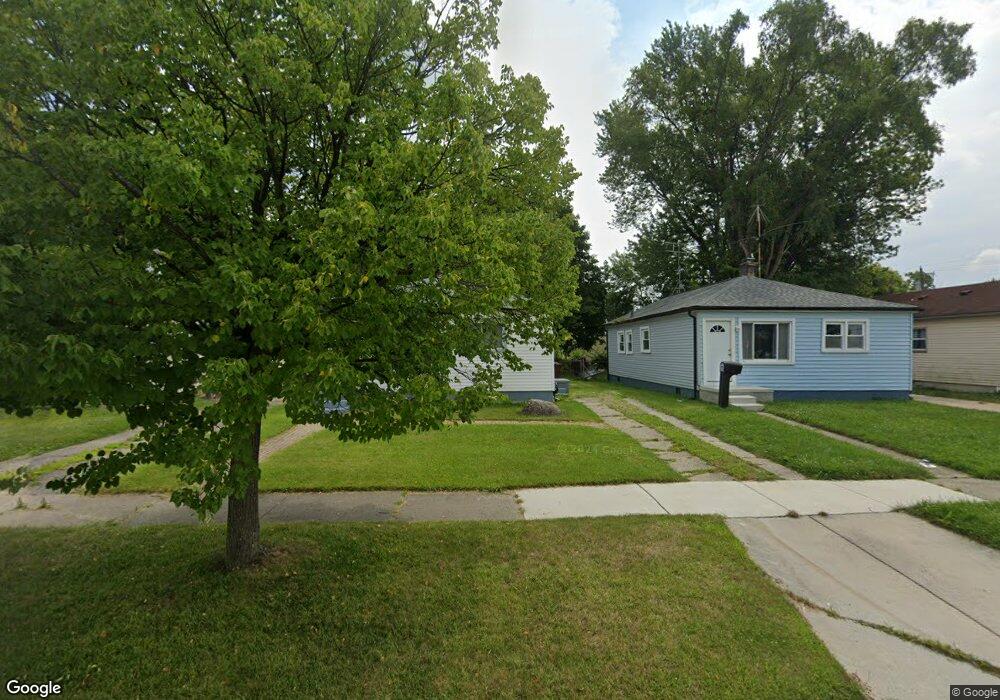
This home is located at 5145 S Hubbard St Unit Bldg-Unit, Wayne, MI 48184 and is currently estimated at $139,432, approximately $145 per square foot. 5145 S Hubbard St Unit Bldg-Unit is a home located in Wayne County with nearby schools including Taft-Galloway Elementary School, Benjamin Franklin Middle School, and Wayne Memorial High School.
Ownership History
Date
Name
Owned For
Owner Type
Purchase Details
Closed on
Sep 28, 2018
Sold by
Duke Jacob
Bought by
Mccray Yolanda R
Current Estimated Value
Home Financials for this Owner
Home Financials are based on the most recent Mortgage that was taken out on this home.
Original Mortgage
$5,040
Outstanding Balance
$4,395
Interest Rate
4.5%
Mortgage Type
Unknown
Estimated Equity
$135,037
Purchase Details
Closed on
Jun 14, 2016
Sold by
Korne Christopher Roy and Korne Marlene Lynn
Bought by
Duke Jacob
Purchase Details
Closed on
Aug 4, 2015
Sold by
Andree Richard and Andree Holly
Bought by
Korne Christopher Roy and Korne Marlene Lynn
Create a Home Valuation Report for This Property
The Home Valuation Report is an in-depth analysis detailing your home's value as well as a comparison with similar homes in the area
Home Values in the Area
Average Home Value in this Area
Purchase History
| Date | Buyer | Sale Price | Title Company |
|---|---|---|---|
| Mccray Yolanda R | $63,000 | None Available | |
| Duke Jacob | $53,000 | Title Solutions Agency Llc | |
| Korne Christopher Roy | -- | Attorney |
Source: Public Records
Mortgage History
| Date | Status | Borrower | Loan Amount |
|---|---|---|---|
| Open | Mccray Yolanda R | $5,040 | |
| Open | Mccray Yolanda R | $61,110 |
Source: Public Records
Tax History
| Year | Tax Paid | Tax Assessment Tax Assessment Total Assessment is a certain percentage of the fair market value that is determined by local assessors to be the total taxable value of land and additions on the property. | Land | Improvement |
|---|---|---|---|---|
| 2025 | $1,645 | $52,800 | $0 | $0 |
| 2024 | $1,605 | $49,700 | $0 | $0 |
| 2023 | $1,532 | $41,200 | $0 | $0 |
| 2022 | $1,772 | $36,400 | $0 | $0 |
| 2021 | $1,725 | $34,500 | $0 | $0 |
| 2020 | $2,108 | $31,400 | $0 | $0 |
| 2019 | $1,384 | $29,500 | $0 | $0 |
| 2018 | $1,028 | $22,700 | $0 | $0 |
| 2017 | $464 | $22,400 | $0 | $0 |
| 2016 | $1,523 | $21,300 | $0 | $0 |
| 2015 | $1,971 | $20,400 | $0 | $0 |
| 2013 | $2,050 | $21,300 | $0 | $0 |
| 2012 | -- | $22,400 | $6,400 | $16,000 |
Source: Public Records
Map
Nearby Homes
- 4815 Mildred St
- 32515 Annapolis St
- 5004 Hayes St
- 31772 Twin Oaks Dr
- 6039 Mission Hills Dr
- 31695 Augusta Dr
- 31649 Augusta Dr Unit 67
- 31627 Augusta Dr Unit 68
- 33445 Bay Hill Dr
- 32178 Carlisle Pkwy
- 33963 Glover St
- 3582 Swanson St
- 3329 Filbert St
- 34294 Glover St
- 32572 Woodbrook Dr
- 34321 John St
- 30905 Beverly Rd
- 6015 Edmund St
- 6029 Edmund St
- 6715 Niagara St
- 5145 S Hubbard St
- 5133 S Hubbard St
- 5157 S Hubbard St
- 5169 S Hubbard St
- 5181 S Hubbard St
- 5144 Mildred St
- 5132 Mildred St
- 5156 Mildred St
- 5120 Mildred St
- 5168 Mildred St
- 5097 S Hubbard St
- 5108 Mildred St
- 5180 Mildred St
- 5085 S Hubbard St
- 5096 Mildred St
- 5084 Mildred St
- 5073 S Hubbard St
- 5072 Mildred St
- 5061 S Hubbard St
- 5060 Mildred St
Your Personal Tour Guide
Ask me questions while you tour the home.