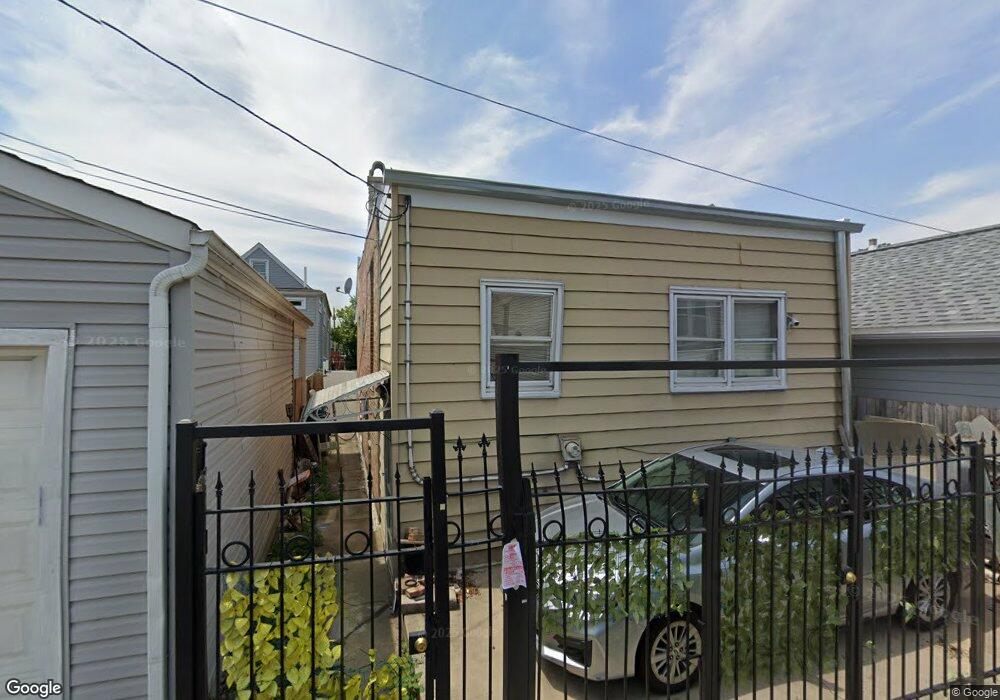
5145 S Maplewood Ave Chicago, IL 60632
Gage Park NeighborhoodEstimated Value: $204,728 - $273,000
2
Beds
1
Bath
770
Sq Ft
$306/Sq Ft
Est. Value
About This Home
This home is located at 5145 S Maplewood Ave, Chicago, IL 60632 and is currently estimated at $235,432, approximately $305 per square foot. 5145 S Maplewood Ave is a home located in Cook County with nearby schools including Nightingale Elementary School, Kelly High School, and Acero - Rufino Tamayo Elementary School.
Ownership History
Date
Name
Owned For
Owner Type
Purchase Details
Closed on
Nov 13, 2003
Sold by
Trujillo Ricardo
Bought by
Nava Juan
Current Estimated Value
Home Financials for this Owner
Home Financials are based on the most recent Mortgage that was taken out on this home.
Original Mortgage
$124,053
Outstanding Balance
$57,551
Interest Rate
6.01%
Mortgage Type
FHA
Estimated Equity
$177,881
Purchase Details
Closed on
Mar 19, 2003
Sold by
Trujillo Ricardo and Trujillo Carmen
Bought by
Trujillo Ricardo
Home Financials for this Owner
Home Financials are based on the most recent Mortgage that was taken out on this home.
Original Mortgage
$85,000
Interest Rate
4.5%
Mortgage Type
Unknown
Purchase Details
Closed on
Apr 15, 1998
Sold by
Quinones Leticia
Bought by
Trujillo Ricardo and Trujillo Carmen
Home Financials for this Owner
Home Financials are based on the most recent Mortgage that was taken out on this home.
Original Mortgage
$69,800
Interest Rate
7.18%
Create a Home Valuation Report for This Property
The Home Valuation Report is an in-depth analysis detailing your home's value as well as a comparison with similar homes in the area
Home Values in the Area
Average Home Value in this Area
Purchase History
| Date | Buyer | Sale Price | Title Company |
|---|---|---|---|
| Nava Juan | $126,000 | Pntn | |
| Trujillo Ricardo | -- | Specialty Title | |
| Trujillo Ricardo | -- | Specialty Title | |
| Trujillo Ricardo | $72,000 | -- |
Source: Public Records
Mortgage History
| Date | Status | Borrower | Loan Amount |
|---|---|---|---|
| Open | Nava Juan | $124,053 | |
| Previous Owner | Trujillo Ricardo | $85,000 | |
| Previous Owner | Trujillo Ricardo | $69,800 |
Source: Public Records
Tax History Compared to Growth
Tax History
| Year | Tax Paid | Tax Assessment Tax Assessment Total Assessment is a certain percentage of the fair market value that is determined by local assessors to be the total taxable value of land and additions on the property. | Land | Improvement |
|---|---|---|---|---|
| 2024 | $1,100 | $15,001 | $1,563 | $13,438 |
| 2023 | $1,051 | $8,500 | $2,656 | $5,844 |
| 2022 | $1,051 | $8,500 | $2,656 | $5,844 |
| 2021 | $1,039 | $8,499 | $2,656 | $5,843 |
| 2020 | $1,399 | $9,343 | $2,656 | $6,687 |
| 2019 | $1,429 | $10,498 | $2,656 | $7,842 |
| 2018 | $1,404 | $10,498 | $2,656 | $7,842 |
| 2017 | $1,151 | $8,686 | $2,343 | $6,343 |
| 2016 | $1,248 | $8,686 | $2,343 | $6,343 |
| 2015 | $1,119 | $8,686 | $2,343 | $6,343 |
| 2014 | $1,118 | $8,546 | $2,187 | $6,359 |
| 2013 | $1,085 | $8,546 | $2,187 | $6,359 |
Source: Public Records
Map
Nearby Homes
- 5142 S Campbell Ave
- 5229 S Campbell Ave
- 5243 S Maplewood Ave
- 5207 S Artesian Ave
- 5247 S Rockwell St
- 5043 S Artesian Ave
- 5119 S Washtenaw Ave
- 5235 S Washtenaw Ave
- 5015 S Fairfield Ave
- 2309 W 50th Place
- 5330 S California Ave
- 5238 S Francisco Ave
- 2208 W 54th Place
- 2103 W 52nd St
- 2453 W 56th St Unit 1
- 2050 W 52nd St
- 5409 S Richmond St
- 5626 S Maplewood Ave
- 5544 S California Ave
- 5254 S Sacramento Ave
- 5143 S Maplewood Ave
- 5147 S Maplewood Ave
- 5141 S Maplewood Ave Unit 1
- 5151 S Maplewood Ave
- 5137 S Maplewood Ave
- 5153 S Maplewood Ave
- 5135 S Maplewood Ave
- 5135 S Maplewood Ave
- 5157 S Maplewood Ave
- 5131 S Maplewood Ave
- 5159 S Maplewood Ave
- 5146 S Campbell Ave
- 5150 S Campbell Ave
- 5140 S Campbell Ave
- 5152 S Campbell Ave
- 5136 S Campbell Ave
- 5129 S Maplewood Ave
- 5158 S Campbell Ave
- 5144 S Campbell Ave
- 5140 S Maplewood Ave Unit 2