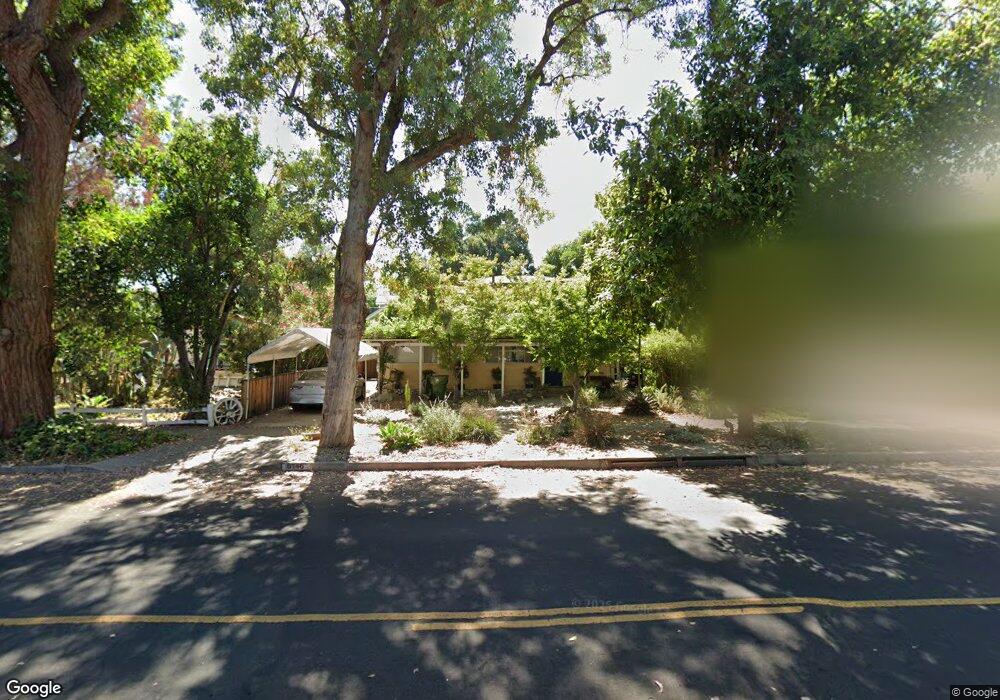
5146 Comercio Ave Woodland Hills, CA 91364
Estimated Value: $1,018,343 - $1,239,000
3
Beds
2
Baths
1,792
Sq Ft
$645/Sq Ft
Est. Value
About This Home
This home is located at 5146 Comercio Ave, Woodland Hills, CA 91364 and is currently estimated at $1,155,336, approximately $644 per square foot. 5146 Comercio Ave is a home located in Los Angeles County with nearby schools including Woodland Hills Academy, Serrania Charter For Enriched Studies, and Woodland Hills Elementary Charter For Enriched Studies.
Ownership History
Date
Name
Owned For
Owner Type
Purchase Details
Closed on
May 13, 2016
Sold by
Beall Garm
Bought by
The Beall Thornburg Family Trust
Current Estimated Value
Purchase Details
Closed on
Mar 22, 2011
Sold by
Beall Garm
Bought by
Beall Garm and Thornburg Gina K
Purchase Details
Closed on
Feb 17, 1999
Sold by
Dela Croix Gerard
Bought by
Beall Garm
Home Financials for this Owner
Home Financials are based on the most recent Mortgage that was taken out on this home.
Original Mortgage
$100,000
Outstanding Balance
$23,588
Interest Rate
6.7%
Estimated Equity
$1,131,748
Purchase Details
Closed on
Jun 3, 1998
Sold by
Dela Croix Gerard
Bought by
Delacroix Gerard and Delacroix Simone
Create a Home Valuation Report for This Property
The Home Valuation Report is an in-depth analysis detailing your home's value as well as a comparison with similar homes in the area
Home Values in the Area
Average Home Value in this Area
Purchase History
| Date | Buyer | Sale Price | Title Company |
|---|---|---|---|
| The Beall Thornburg Family Trust | -- | None Available | |
| Beall Garm | -- | None Available | |
| Beall Garm | $200,000 | Progressive Title Company | |
| Delacroix Gerard | -- | -- |
Source: Public Records
Mortgage History
| Date | Status | Borrower | Loan Amount |
|---|---|---|---|
| Open | Beall Garm | $100,000 |
Source: Public Records
Tax History Compared to Growth
Tax History
| Year | Tax Paid | Tax Assessment Tax Assessment Total Assessment is a certain percentage of the fair market value that is determined by local assessors to be the total taxable value of land and additions on the property. | Land | Improvement |
|---|---|---|---|---|
| 2025 | $5,306 | $419,407 | $250,823 | $168,584 |
| 2024 | $5,306 | $411,184 | $245,905 | $165,279 |
| 2023 | $5,208 | $403,123 | $241,084 | $162,039 |
| 2022 | $4,992 | $395,219 | $236,357 | $158,862 |
| 2021 | $4,926 | $387,471 | $231,723 | $155,748 |
| 2019 | $4,784 | $375,979 | $224,850 | $151,129 |
| 2018 | $4,725 | $368,608 | $220,442 | $148,166 |
| 2016 | $4,493 | $354,296 | $211,883 | $142,413 |
| 2015 | $4,430 | $348,975 | $208,701 | $140,274 |
| 2014 | $4,451 | $342,140 | $204,613 | $137,527 |
Source: Public Records
Map
Nearby Homes
- 21115 Lopez St
- 5223 Alhama Dr
- 5119 Escobedo Dr
- 5105 Escobedo Dr
- 5108 Escobedo Dr
- 5102 Escobedo Dr
- 0 Lopez St
- 5130 Medina Rd
- 5134 Medina Rd
- 5102 Medina Rd
- 5052 Medina Rd
- 5305 Campo Rd
- 5335 Medina Rd
- 5140 Baza Ave
- 5040 Marmol Dr
- 4938 Medina Rd
- 4256 Canoga Ave
- 5143 Escobedo Dr
- 5015 Calatrana Dr
- 4922 Escobedo Dr
- 21330 Celes St
- 5140 Comercio Ave
- 21322 Celes St
- 5132 Comercio Ave
- 21316 Celes St
- 21331 Lopez St
- 5162 Comercio Ave
- 21325 Lopez St
- 21312 Celes St
- 5147 Comercio Ave
- 5141 Comercio Ave
- 5166 Comercio Ave
- 5151 Comercio Ave
- 21321 Celes St
- 5135 Comercio Ave
- 21323 Lopez St
- 21306 Celes St
- 21317 Lopez St
- 5163 Comercio Ave
- 21311 Celes St Unit P16