Estimated Value: $389,000 - $410,000
4
Beds
2
Baths
1,850
Sq Ft
$215/Sq Ft
Est. Value
About This Home
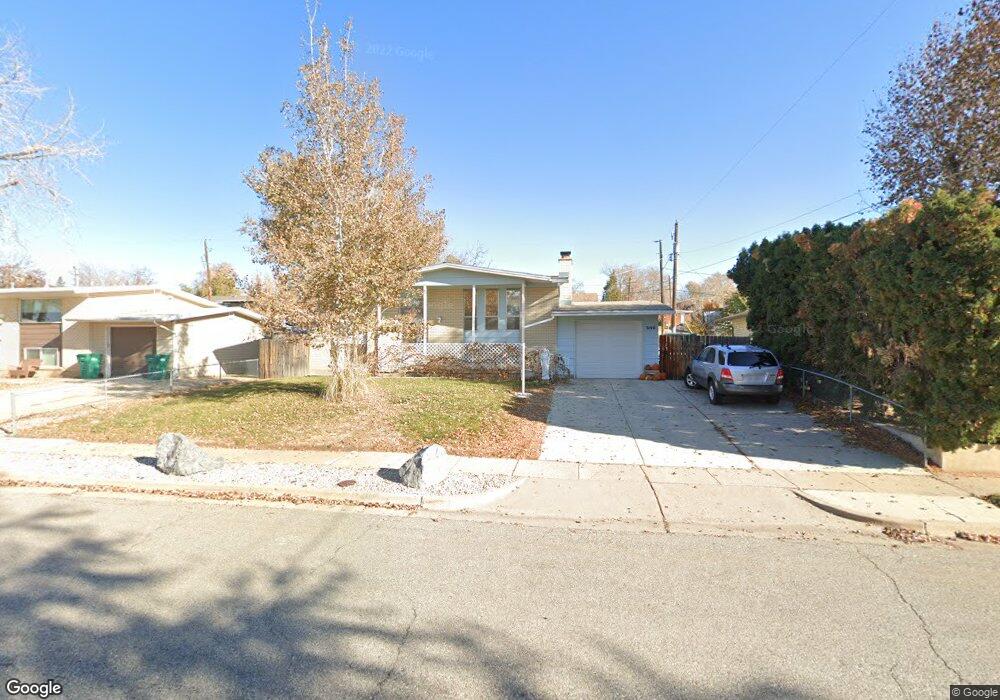
This home is located at 5146 S 2600 W, Roy, UT 84067 and is currently estimated at $396,931, approximately $214 per square foot. 5146 S 2600 W is a home located in Weber County with nearby schools including Lakeview Elementary School, Roy Junior High School, and Roy High School.
Ownership History
Date
Name
Owned For
Owner Type
Purchase Details
Closed on
Sep 18, 2013
Sold by
Curtis Steven L
Bought by
Neville Jerimy
Current Estimated Value
Home Financials for this Owner
Home Financials are based on the most recent Mortgage that was taken out on this home.
Original Mortgage
$160,047
Outstanding Balance
$121,066
Interest Rate
4.75%
Mortgage Type
FHA
Estimated Equity
$275,865
Purchase Details
Closed on
Feb 2, 2012
Sold by
Zahn Dale Arthur and Zahn Patricia Ann
Bought by
Curtis Steven L
Home Financials for this Owner
Home Financials are based on the most recent Mortgage that was taken out on this home.
Original Mortgage
$121,831
Interest Rate
3.99%
Mortgage Type
FHA
Purchase Details
Closed on
May 31, 2001
Sold by
Zahn Dale Arthur and Zahn Patricia A
Bought by
Zahn Dale Arthur and Zahn Patricia Ann
Create a Home Valuation Report for This Property
The Home Valuation Report is an in-depth analysis detailing your home's value as well as a comparison with similar homes in the area
Home Values in the Area
Average Home Value in this Area
Purchase History
| Date | Buyer | Sale Price | Title Company |
|---|---|---|---|
| Neville Jerimy | -- | Us Title Insurance Agnecy | |
| Curtis Steven L | -- | Founders Title Company Syrac | |
| Zahn Dale Arthur | -- | -- |
Source: Public Records
Mortgage History
| Date | Status | Borrower | Loan Amount |
|---|---|---|---|
| Open | Neville Jerimy | $160,047 | |
| Previous Owner | Curtis Steven L | $121,831 | |
| Previous Owner | Curtis Steven L | $7,100 |
Source: Public Records
Tax History
| Year | Tax Paid | Tax Assessment Tax Assessment Total Assessment is a certain percentage of the fair market value that is determined by local assessors to be the total taxable value of land and additions on the property. | Land | Improvement |
|---|---|---|---|---|
| 2025 | $2,393 | $375,332 | $115,672 | $259,660 |
| 2024 | $2,336 | $202,949 | $63,620 | $139,329 |
| 2023 | $2,211 | $191,950 | $61,354 | $130,596 |
| 2022 | $2,374 | $213,950 | $53,792 | $160,158 |
| 2021 | $1,847 | $271,000 | $68,071 | $202,929 |
| 2020 | $1,716 | $231,000 | $68,071 | $162,929 |
| 2019 | $1,708 | $217,000 | $40,016 | $176,984 |
| 2018 | $1,559 | $185,000 | $36,015 | $148,985 |
| 2017 | $1,460 | $161,741 | $36,015 | $125,726 |
| 2016 | $1,425 | $84,973 | $18,525 | $66,448 |
| 2015 | $1,225 | $73,594 | $15,708 | $57,886 |
| 2014 | $1,179 | $69,647 | $15,708 | $53,939 |
Source: Public Records
Map
Nearby Homes
Your Personal Tour Guide
Ask me questions while you tour the home.