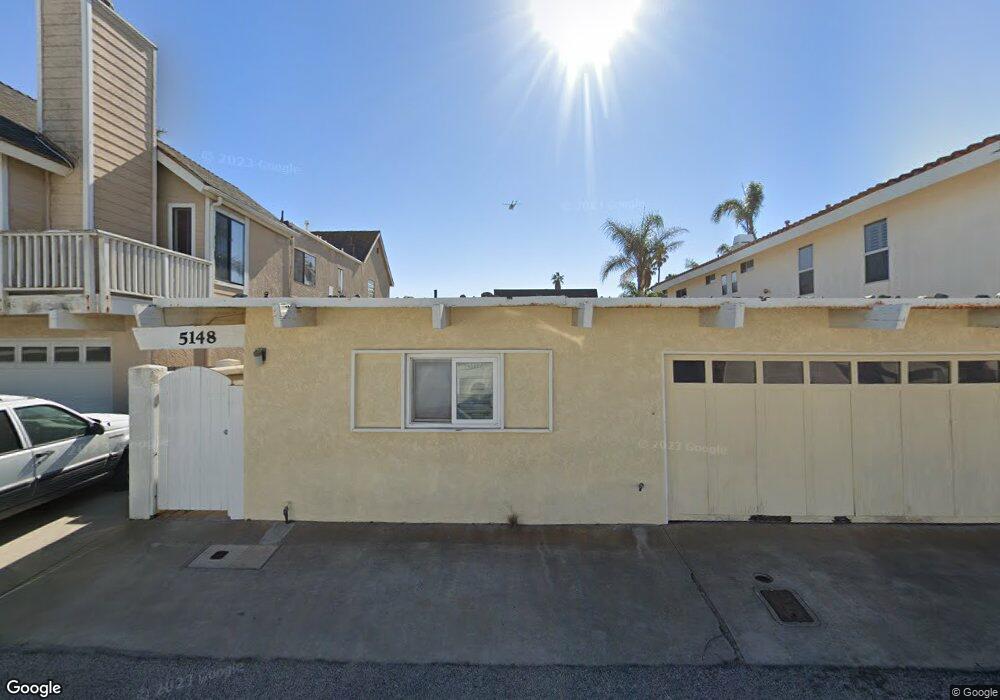
5148 Outrigger Way Oxnard, CA 93035
Oxnard Shores NeighborhoodEstimated Value: $1,313,323 - $1,496,000
3
Beds
2
Baths
1,761
Sq Ft
$795/Sq Ft
Est. Value
About This Home
This home is located at 5148 Outrigger Way, Oxnard, CA 93035 and is currently estimated at $1,400,831, approximately $795 per square foot. 5148 Outrigger Way is a home located in Ventura County with nearby schools including Christa Mcauliffe Elementary School and Oxnard High School.
Ownership History
Date
Name
Owned For
Owner Type
Purchase Details
Closed on
Jun 3, 2002
Sold by
Jacobson Frederick C and Jacobson Cindy M
Bought by
Jacobson Frederick C and Jacobson Cindy M
Current Estimated Value
Purchase Details
Closed on
Apr 12, 1999
Sold by
Scott Diana
Bought by
Jacobson Frederick C and Jacobson Cindy M
Home Financials for this Owner
Home Financials are based on the most recent Mortgage that was taken out on this home.
Original Mortgage
$233,600
Outstanding Balance
$59,447
Interest Rate
7.1%
Estimated Equity
$1,341,384
Purchase Details
Closed on
May 12, 1997
Sold by
Patricia Powers and Powers Shaw Patricia
Bought by
Scott Diana
Home Financials for this Owner
Home Financials are based on the most recent Mortgage that was taken out on this home.
Original Mortgage
$228,000
Interest Rate
8.25%
Purchase Details
Closed on
May 16, 1994
Sold by
Roe Patricia P
Bought by
Powers Patricia
Create a Home Valuation Report for This Property
The Home Valuation Report is an in-depth analysis detailing your home's value as well as a comparison with similar homes in the area
Home Values in the Area
Average Home Value in this Area
Purchase History
| Date | Buyer | Sale Price | Title Company |
|---|---|---|---|
| Jacobson Frederick C | -- | -- | |
| Jacobson Frederick C | $292,000 | Stewart Title | |
| Scott Diana | $240,000 | Chicago Title Co | |
| Powers Patricia | -- | -- |
Source: Public Records
Mortgage History
| Date | Status | Borrower | Loan Amount |
|---|---|---|---|
| Open | Jacobson Frederick C | $233,600 | |
| Previous Owner | Scott Diana | $228,000 |
Source: Public Records
Tax History
| Year | Tax Paid | Tax Assessment Tax Assessment Total Assessment is a certain percentage of the fair market value that is determined by local assessors to be the total taxable value of land and additions on the property. | Land | Improvement |
|---|---|---|---|---|
| 2025 | $5,556 | $457,739 | $313,531 | $144,208 |
| 2024 | $5,556 | $448,764 | $307,383 | $141,381 |
| 2023 | $5,353 | $439,965 | $301,356 | $138,609 |
| 2022 | $5,192 | $431,339 | $295,447 | $135,892 |
| 2021 | $5,151 | $422,882 | $289,654 | $133,228 |
| 2020 | $5,246 | $418,548 | $286,685 | $131,863 |
| 2019 | $5,098 | $410,342 | $281,064 | $129,278 |
| 2018 | $5,027 | $402,297 | $275,553 | $126,744 |
| 2017 | $4,771 | $394,409 | $270,150 | $124,259 |
| 2016 | $4,604 | $386,676 | $264,853 | $121,823 |
| 2015 | $4,653 | $380,870 | $260,876 | $119,994 |
| 2014 | $4,602 | $373,412 | $255,767 | $117,645 |
Source: Public Records
Map
Nearby Homes
- 5121 Breakwater Way
- 5125 W Wooley Rd Unit 5
- 5244 Whitecap St
- 5120 Seabreeze Way
- 5120 Terramar Way
- 5124 Beachcomber St
- 1095 Canal St
- 4906 Dunes St
- 1230 Mandalay Beach Rd
- 4941 Catamaran St
- 1135 Capri Way
- 1000 Mandalay Beach Rd
- 4901 Catamaran St
- 920 Catamaran St
- 1251 Mandalay Beach Rd
- 1068 Canal St
- 5202 Driftwood St
- 5442 Driftwood St
- 815 Mandalay Beach Rd
- 5142 Marlin Way
- 5142 Outrigger Way
- 5152 Outrigger Way
- 5138 Outrigger Way Unit Upstairs
- 5138 Outrigger Way
- 5138 Outrigger Way Unit 1
- 5138 Outrigger Way Unit Main
- 5138 Outrigger Way
- 5202 Outrigger Way
- 67 Lot Outrigger Way
- 5127 Breakwater Way
- 5131 Breakwater Way
- 5210 Outrigger Way
- 5134 Outrigger Way
- 5144 Whitecap St
- 5150 Whitecap St
- 5140 Whitecap St
- 5115 Breakwater Way
- 5137 Breakwater Way
- 5136 Whitecap St
- 5200 Whitecap St
Your Personal Tour Guide
Ask me questions while you tour the home.