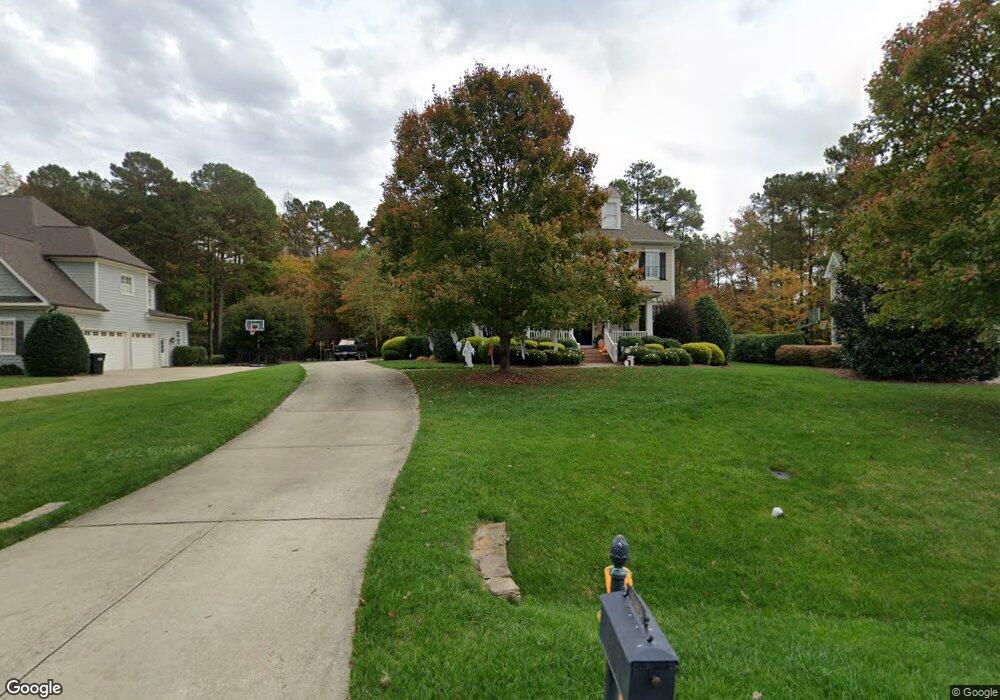
5149 Terra Cotta Dr Raleigh, NC 27613
Estimated Value: $935,354 - $1,062,000
5
Beds
5
Baths
4,126
Sq Ft
$246/Sq Ft
Est. Value
About This Home
This home is located at 5149 Terra Cotta Dr, Raleigh, NC 27613 and is currently estimated at $1,013,089, approximately $245 per square foot. 5149 Terra Cotta Dr is a home located in Wake County with nearby schools including Pine Hollow Middle School, Leesville Road High School, and The Franciscan School.
Ownership History
Date
Name
Owned For
Owner Type
Purchase Details
Closed on
Aug 8, 2013
Sold by
Nugent Timothy Penn and Nugent Mary Jo
Bought by
Zuleba Christopher B and Zuleba Virginia M
Current Estimated Value
Home Financials for this Owner
Home Financials are based on the most recent Mortgage that was taken out on this home.
Original Mortgage
$617,000
Outstanding Balance
$463,020
Interest Rate
4.62%
Mortgage Type
Adjustable Rate Mortgage/ARM
Estimated Equity
$550,069
Purchase Details
Closed on
Jan 12, 2007
Sold by
Woodard Builders Inc
Bought by
Nugent Timothy Penn and Nugent Mary Jo
Home Financials for this Owner
Home Financials are based on the most recent Mortgage that was taken out on this home.
Original Mortgage
$417,000
Interest Rate
6.14%
Mortgage Type
Purchase Money Mortgage
Create a Home Valuation Report for This Property
The Home Valuation Report is an in-depth analysis detailing your home's value as well as a comparison with similar homes in the area
Home Values in the Area
Average Home Value in this Area
Purchase History
| Date | Buyer | Sale Price | Title Company |
|---|---|---|---|
| Zuleba Christopher B | $650,000 | None Available | |
| Nugent Timothy Penn | $645,000 | None Available |
Source: Public Records
Mortgage History
| Date | Status | Borrower | Loan Amount |
|---|---|---|---|
| Open | Zuleba Christopher B | $617,000 | |
| Previous Owner | Nugent Timothy Penn | $417,000 |
Source: Public Records
Tax History Compared to Growth
Tax History
| Year | Tax Paid | Tax Assessment Tax Assessment Total Assessment is a certain percentage of the fair market value that is determined by local assessors to be the total taxable value of land and additions on the property. | Land | Improvement |
|---|---|---|---|---|
| 2025 | $5,110 | $795,813 | $140,000 | $655,813 |
| 2024 | $4,962 | $795,813 | $140,000 | $655,813 |
| 2023 | $5,446 | $695,851 | $105,000 | $590,851 |
| 2022 | $5,045 | $695,851 | $105,000 | $590,851 |
| 2021 | $4,910 | $695,851 | $105,000 | $590,851 |
| 2020 | $4,828 | $695,851 | $105,000 | $590,851 |
| 2019 | $4,888 | $596,053 | $105,000 | $491,053 |
| 2018 | $4,493 | $596,053 | $105,000 | $491,053 |
| 2017 | $4,258 | $596,053 | $105,000 | $491,053 |
| 2016 | $4,172 | $596,053 | $105,000 | $491,053 |
| 2015 | $4,619 | $662,148 | $120,000 | $542,148 |
| 2014 | $4,377 | $662,148 | $120,000 | $542,148 |
Source: Public Records
Map
Nearby Homes
- 2409 Loring Ct
- 12304 Whartons Way
- 2612 Scarlet Sage Ct
- 2729 Sunnystone Way
- 2011 Carpenter Pond Rd
- 5528 Hawthorne Park
- 11953 Eagle Cliff Ct
- 11913 Eagle Bluff Cir
- 1804 Carpenter Pond Rd
- 5308 Roan Mountain Place
- 11804 Mountbatten Way
- 5965 Dunbarton Way
- 8717 Little Deer Ln
- 11017 Peacock Moss St
- 2506 Coley Rd
- 1204 Meadow Moss Ct
- 5316 Easthorpe Dr
- 5008 Tallwood Dr
- 11113 N Radner Way
- 5501 Stewartby Dr
- 5145 Terra Cotta Dr
- 5153 Terra Cotta Dr
- 5141 Terra Cotta Dr
- 5157 Terra Cotta Dr
- 5148 Terra Cotta Dr
- 5137 Terra Cotta Dr
- 2600 Rock Oak Ct
- 2428 Sunnystone Way
- 12713 Victory Church Rd
- 2424 Sunnystone Way
- 5133 Terra Cotta Dr
- 2420 Sunnystone Way
- 2432 Sunnystone Way
- 5144 Terra Cotta Dr
- 5140 Terra Cotta Dr
- 2608 Rock Oak Ct
- 2601 Rock Oak Ct
- 2601 Rock Oak Ct Unit n/a
- 5129 Terra Cotta Dr
- 2605 Rock Oak Ct