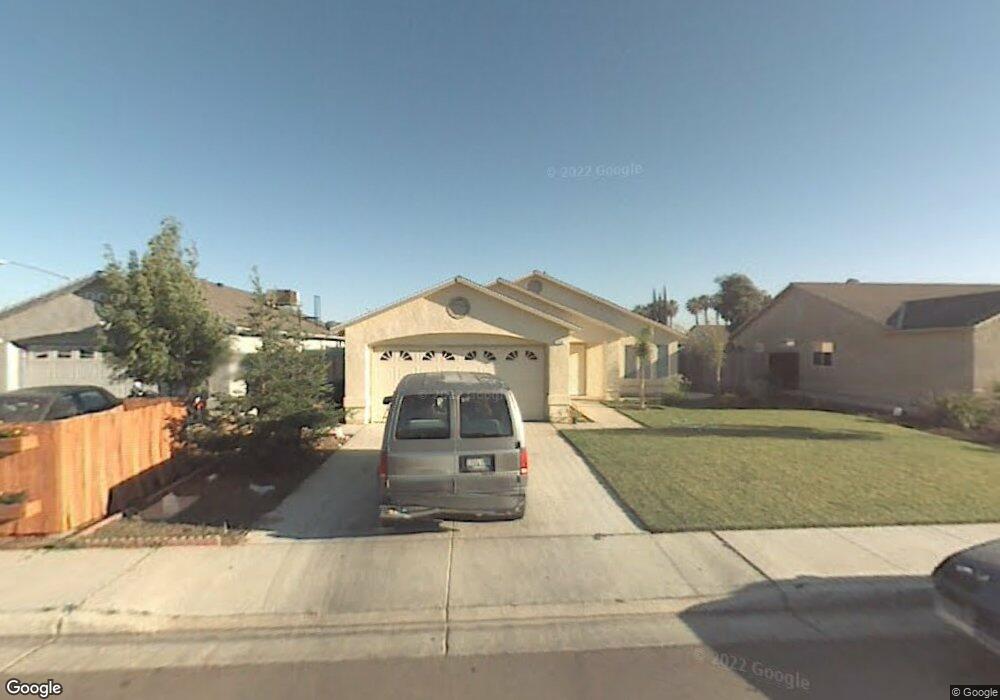
515 6th St Sanger, CA 93657
Estimated Value: $283,000 - $386,000
3
Beds
2
Baths
1,196
Sq Ft
$281/Sq Ft
Est. Value
About This Home
This home is located at 515 6th St, Sanger, CA 93657 and is currently estimated at $336,489, approximately $281 per square foot. 515 6th St is a home located in Fresno County with nearby schools including Wilson Elementary School, Washington Academic Middle School, and Sanger High School.
Ownership History
Date
Name
Owned For
Owner Type
Purchase Details
Closed on
Nov 18, 2003
Sold by
Mission Development 5084
Bought by
Aleman Sergio and Aleman Alma
Current Estimated Value
Home Financials for this Owner
Home Financials are based on the most recent Mortgage that was taken out on this home.
Original Mortgage
$113,371
Outstanding Balance
$52,559
Interest Rate
6%
Mortgage Type
FHA
Estimated Equity
$283,930
Create a Home Valuation Report for This Property
The Home Valuation Report is an in-depth analysis detailing your home's value as well as a comparison with similar homes in the area
Home Values in the Area
Average Home Value in this Area
Purchase History
| Date | Buyer | Sale Price | Title Company |
|---|---|---|---|
| Aleman Sergio | $115,500 | Financial Title Company |
Source: Public Records
Mortgage History
| Date | Status | Borrower | Loan Amount |
|---|---|---|---|
| Open | Aleman Sergio | $113,371 | |
| Closed | Aleman Sergio | $3,454 |
Source: Public Records
Tax History
| Year | Tax Paid | Tax Assessment Tax Assessment Total Assessment is a certain percentage of the fair market value that is determined by local assessors to be the total taxable value of land and additions on the property. | Land | Improvement |
|---|---|---|---|---|
| 2025 | $2,068 | $169,074 | $49,752 | $119,322 |
| 2023 | $1,933 | $162,511 | $47,821 | $114,690 |
| 2022 | $1,903 | $159,326 | $46,884 | $112,442 |
| 2021 | $1,886 | $156,203 | $45,965 | $110,238 |
| 2020 | $1,830 | $154,602 | $45,494 | $109,108 |
| 2019 | $1,792 | $151,571 | $44,602 | $106,969 |
| 2018 | $1,716 | $148,600 | $43,728 | $104,872 |
| 2017 | $1,685 | $145,687 | $42,871 | $102,816 |
| 2016 | $1,583 | $142,831 | $42,031 | $100,800 |
| 2015 | $1,315 | $116,800 | $34,200 | $82,600 |
| 2014 | $1,237 | $109,500 | $32,100 | $77,400 |
Source: Public Records
Map
Nearby Homes
- 525 Tucker Ave
- 424 Morton Ave
- 913 Harriett Ave
- 658 Rebeca Ave
- 531 K St
- 720 L St
- 983 Church Ave
- 426 L St
- 123 Florence Avenue at Pearl Ave
- 1240 J St
- 521 O St
- 1428 J St
- 85 Acacia Dr
- 1407 Academy Ave
- 1312 P St
- 824 Hoag Ave
- 3670 S Newmark Ave
- 3680 S Newmark Ave
- 0 E Annadale Ave Unit W. of S. Riverbend A
- 1105 Hoag Ave