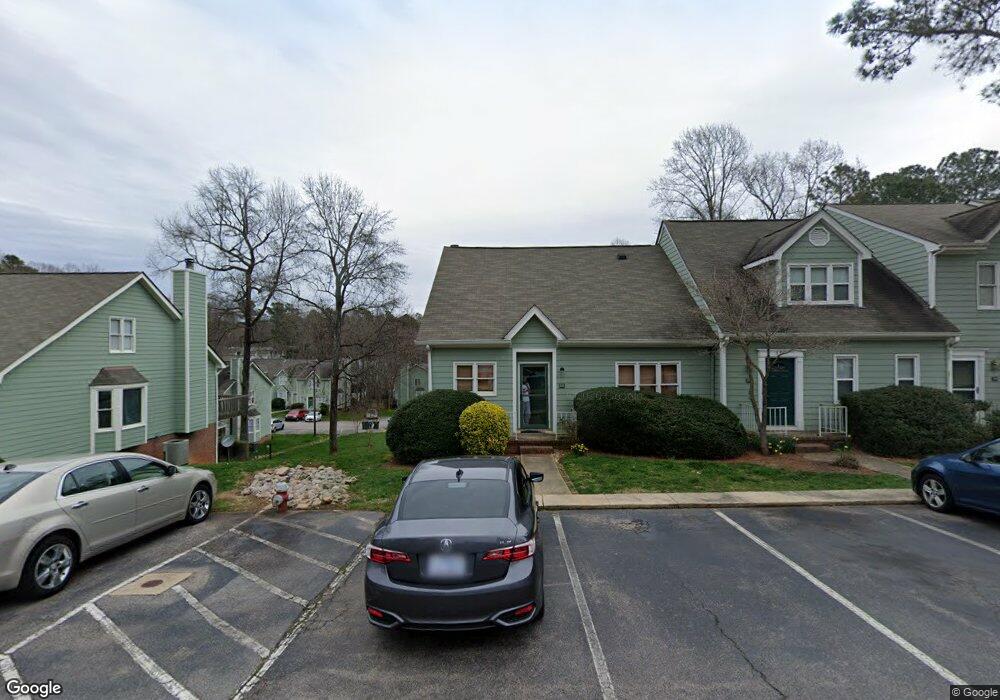
515 Caprice Ct Raleigh, NC 27606
Cary Towne Center NeighborhoodEstimated Value: $283,000 - $319,000
3
Beds
3
Baths
1,700
Sq Ft
$173/Sq Ft
Est. Value
About This Home
This home is located at 515 Caprice Ct, Raleigh, NC 27606 and is currently estimated at $293,618, approximately $172 per square foot. 515 Caprice Ct is a home located in Wake County with nearby schools including Reedy Creek Elementary School, Reedy Creek Magnet Middle School, and GRACE Christian School.
Ownership History
Date
Name
Owned For
Owner Type
Purchase Details
Closed on
Dec 15, 2006
Sold by
Phillips Ronald C and Phillips Janet L
Bought by
Gaul Melissa A and Gaul Susan J
Current Estimated Value
Home Financials for this Owner
Home Financials are based on the most recent Mortgage that was taken out on this home.
Original Mortgage
$126,000
Outstanding Balance
$78,657
Interest Rate
7.12%
Mortgage Type
Unknown
Estimated Equity
$214,961
Purchase Details
Closed on
Sep 28, 2004
Sold by
Phillips Weatherly Jacqueline
Bought by
Phillips Ronald C and Phillips Janet L
Purchase Details
Closed on
Dec 14, 1999
Sold by
Mann Lawrence T and Mann Linda C
Bought by
Phillips Weatherly Jacqueline
Home Financials for this Owner
Home Financials are based on the most recent Mortgage that was taken out on this home.
Original Mortgage
$64,900
Interest Rate
7.85%
Create a Home Valuation Report for This Property
The Home Valuation Report is an in-depth analysis detailing your home's value as well as a comparison with similar homes in the area
Home Values in the Area
Average Home Value in this Area
Purchase History
| Date | Buyer | Sale Price | Title Company |
|---|---|---|---|
| Gaul Melissa A | $126,500 | None Available | |
| Phillips Ronald C | $119,000 | -- | |
| Phillips Weatherly Jacqueline | $121,000 | -- |
Source: Public Records
Mortgage History
| Date | Status | Borrower | Loan Amount |
|---|---|---|---|
| Open | Gaul Melissa A | $126,000 | |
| Previous Owner | Phillips Weatherly Jacqueline | $64,900 |
Source: Public Records
Tax History
| Year | Tax Paid | Tax Assessment Tax Assessment Total Assessment is a certain percentage of the fair market value that is determined by local assessors to be the total taxable value of land and additions on the property. | Land | Improvement |
|---|---|---|---|---|
| 2025 | $2,620 | $298,158 | $55,000 | $243,158 |
| 2024 | $2,610 | $298,158 | $55,000 | $243,158 |
Source: Public Records
Map
Nearby Homes
- 551 Oak Run Dr
- 5608 Kimsey Ct
- 512 Bashford Rd
- 415 Bashford Rd
- 6014 Farm Gate Rd
- 723 Orchard Vista Cir
- 5920 Farm Gate Rd
- 2027 Oakdale Dr
- 732 Orchard Vista Cir
- 730 Orchard Vista Cir
- 721 Orchard Vista Cir
- 726 Orchard Vista Cir
- 724 Orchard Vista Cir
- 722 Orchard Vista Cir
- 720 Orchard Vista Cir
- 701 Godwin Ct
- 712 Godwin Ct
- 10 Red Ln
- 113 Fieldspring Ln
- 6403 Myra Rd
- 517 Caprice Ct
- 519 Caprice Ct
- 511 Caprice Ct
- 521 Caprice Ct
- 523 Caprice Ct
- 509 Caprice Ct Unit 108
- 507 Caprice Ct Unit 101
- 525 Caprice Ct
- 500 Oak Run Dr
- 505 Caprice Ct
- 458 Oak Run Dr
- 502 Oak Run Dr
- 503 Caprice Ct
- 504 Oak Run Dr
- 510 Caprice Ct
- 456 Oak Run Dr Unit 76
- 514 Caprice Ct
- 506 Oak Run Dr
- 508 Caprice Ct
- 518 Caprice Ct
Your Personal Tour Guide
Ask me questions while you tour the home.