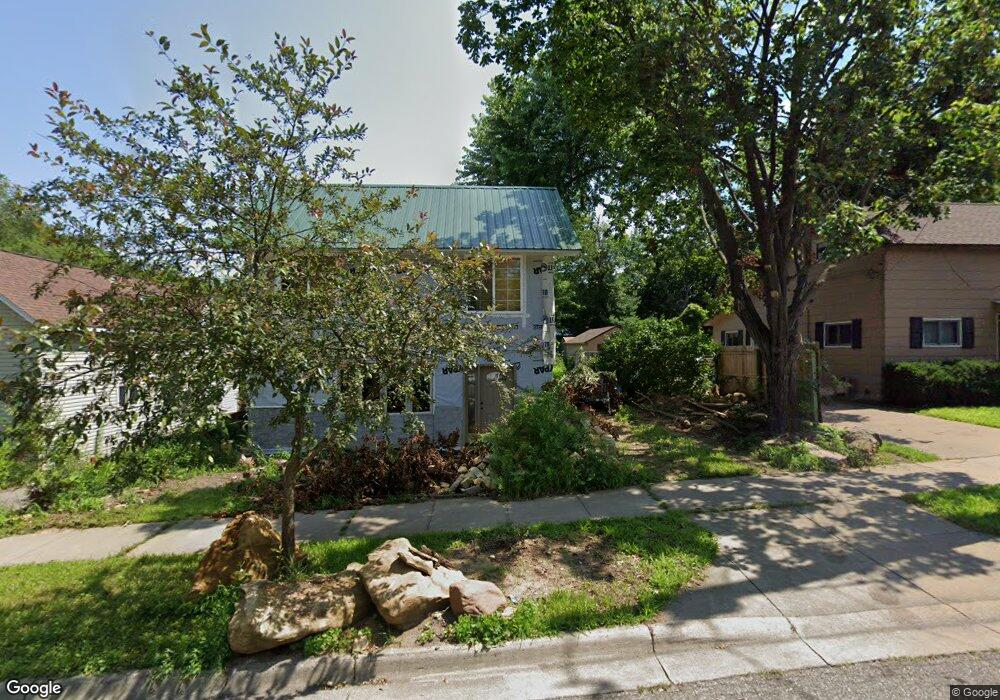
515 Centennial St Red Wing, MN 55066
Estimated Value: $189,000 - $332,000
3
Beds
1
Bath
1,782
Sq Ft
$134/Sq Ft
Est. Value
About This Home
This home is located at 515 Centennial St, Red Wing, MN 55066 and is currently estimated at $238,983, approximately $134 per square foot. 515 Centennial St is a home located in Goodhue County with nearby schools including Sunnyside Elementary School, Burnside Elementary School, and Twin Bluff Middle School.
Ownership History
Date
Name
Owned For
Owner Type
Purchase Details
Closed on
Dec 29, 2023
Sold by
Holmes Clayton
Bought by
Devries Brent and Devries Ashley
Current Estimated Value
Home Financials for this Owner
Home Financials are based on the most recent Mortgage that was taken out on this home.
Original Mortgage
$120,000
Outstanding Balance
$117,883
Interest Rate
7.44%
Mortgage Type
New Conventional
Estimated Equity
$121,101
Purchase Details
Closed on
Aug 28, 2003
Sold by
Wells Fargo Home Mtg Inc
Bought by
Holmes Clayton A
Purchase Details
Closed on
Jun 26, 2000
Sold by
Dols Marie T
Bought by
Babler Gary R and Babler Charlotte E
Purchase Details
Closed on
Feb 19, 1999
Sold by
Stumpf Troy A
Bought by
Babler Gary and Babler Charlotte
Purchase Details
Closed on
Jul 1, 1998
Sold by
Dols Marie T
Bought by
Stumpf Troy A
Purchase Details
Closed on
Jun 26, 1998
Sold by
Bremer Robert J and Bremer Terri A
Bought by
Dols Marie T
Create a Home Valuation Report for This Property
The Home Valuation Report is an in-depth analysis detailing your home's value as well as a comparison with similar homes in the area
Home Values in the Area
Average Home Value in this Area
Purchase History
| Date | Buyer | Sale Price | Title Company |
|---|---|---|---|
| Devries Brent | $120,000 | -- | |
| Holmes Clayton A | $36,000 | -- | |
| Babler Gary R | $34,900 | -- | |
| Babler Gary | $34,900 | -- | |
| Stumpf Troy A | $29,900 | -- | |
| Dols Marie T | $26,000 | -- |
Source: Public Records
Mortgage History
| Date | Status | Borrower | Loan Amount |
|---|---|---|---|
| Open | Devries Brent | $120,000 | |
| Closed | Stumpf Troy A | -- |
Source: Public Records
Tax History Compared to Growth
Tax History
| Year | Tax Paid | Tax Assessment Tax Assessment Total Assessment is a certain percentage of the fair market value that is determined by local assessors to be the total taxable value of land and additions on the property. | Land | Improvement |
|---|---|---|---|---|
| 2025 | $2,156 | $161,800 | $27,900 | $133,900 |
| 2024 | $2,156 | $159,200 | $27,900 | $131,300 |
| 2023 | $2,036 | $151,000 | $27,900 | $123,100 |
| 2022 | $1,490 | $150,100 | $27,900 | $122,200 |
| 2021 | $1,248 | $99,600 | $27,900 | $71,700 |
| 2020 | $1,208 | $84,500 | $27,900 | $56,600 |
| 2019 | $1,108 | $76,300 | $27,900 | $48,400 |
| 2018 | $790 | $70,800 | $25,400 | $45,400 |
| 2017 | $1,172 | $53,500 | $25,400 | $28,100 |
| 2016 | $718 | $80,300 | $25,400 | $54,900 |
| 2015 | $628 | $78,400 | $25,400 | $53,000 |
| 2014 | -- | $69,100 | $25,400 | $43,700 |
Source: Public Records
Map
Nearby Homes
- 225 E 5th St
- 613 Potter St
- XXXX Skyline Heights
- 737 McSorley St
- 759 Plum St
- 1547 Bush St
- 222 Bush St Unit 402
- 222 Bush St Unit 302
- 222 Bush St Unit 404
- 222 Bush St Unit 303
- 222 Bush St Unit 301
- 222 Bush St Unit 304
- 222 Bush St Unit 401
- 523 East Ave Unit 211
- 523 East Ave Unit 213
- 1524 Bush St
- 1109 East Ave
- 781 E 7th St
- 466 14th St
- 1218 East Ave
- 521 Centennial St
- 511 Centennial St
- 527 Centennial St
- 507 Centennial St
- 525 Centennial St
- 601 Centennial St
- 501 Centennial St
- 425 1/2 E 5th St
- 605 Centennial St
- 425 E 5th St
- 429 E 5th St
- 506 Centennial St
- 520 Centennial St
- 514 Centennial St
- 609 Centennial St
- 526 Centennial St
- 502 Centennial St
- 613 Centennial St
- 602 Centennial St
- 410 E 5th St