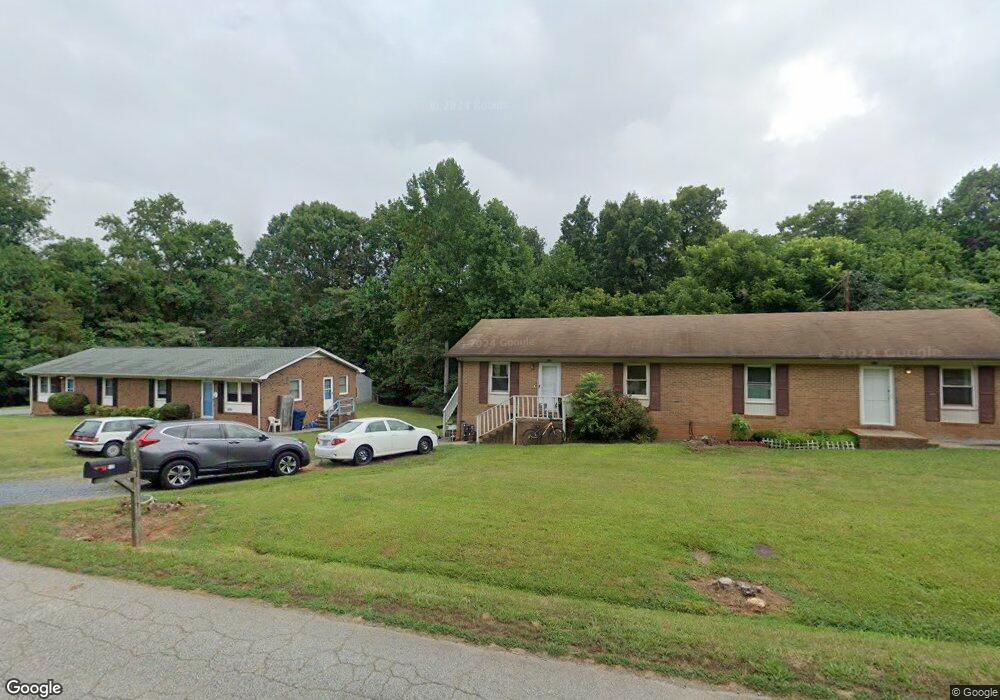
515 E Brown St Randleman, NC 27317
Estimated Value: $262,197 - $358,000
Studio
2
Baths
1,716
Sq Ft
$179/Sq Ft
Est. Value
About This Home
This home is located at 515 E Brown St, Randleman, NC 27317 and is currently estimated at $307,049, approximately $178 per square foot. 515 E Brown St is a home with nearby schools including Randleman Elementary School, Randleman Middle School, and Randleman High School.
Ownership History
Date
Name
Owned For
Owner Type
Purchase Details
Closed on
Sep 28, 2018
Sold by
Starr Charles W and Starr Sherry F
Bought by
Stanley T W T and Stanley Tiffany L
Current Estimated Value
Purchase Details
Closed on
Dec 14, 2017
Sold by
Baybuilt Properties Llc
Bought by
Stanley T W and Stanley Tiffany L
Purchase Details
Closed on
Jul 26, 2017
Sold by
Bear Real Estate Investments Llc
Bought by
Baybuilt Properties Llc
Purchase Details
Closed on
May 3, 2011
Sold by
Jeb Investment Properties Llc
Bought by
Bear Real Estate Investments Llc
Home Financials for this Owner
Home Financials are based on the most recent Mortgage that was taken out on this home.
Original Mortgage
$130,100
Interest Rate
4.83%
Mortgage Type
Future Advance Clause Open End Mortgage
Purchase Details
Closed on
Mar 15, 2010
Sold by
Crm Mid Atlantic Properties Llc
Bought by
Jeb Investments Properties Llc
Create a Home Valuation Report for This Property
The Home Valuation Report is an in-depth analysis detailing your home's value as well as a comparison with similar homes in the area
Home Values in the Area
Average Home Value in this Area
Purchase History
| Date | Buyer | Sale Price | Title Company |
|---|---|---|---|
| Stanley T W T | $180,000 | None Available | |
| Stanley T W | $168,000 | None Available | |
| Baybuilt Properties Llc | $104,500 | None Available | |
| Bear Real Estate Investments Llc | $11,000 | None Available | |
| Jeb Investments Properties Llc | $116,500 | None Available |
Source: Public Records
Mortgage History
| Date | Status | Borrower | Loan Amount |
|---|---|---|---|
| Previous Owner | Bear Real Estate Investments Llc | $130,100 |
Source: Public Records
Tax History
| Year | Tax Paid | Tax Assessment Tax Assessment Total Assessment is a certain percentage of the fair market value that is determined by local assessors to be the total taxable value of land and additions on the property. | Land | Improvement |
|---|---|---|---|---|
| 2025 | $3,458 | $223,250 | $33,530 | $189,720 |
| 2024 | $3,458 | $223,250 | $33,530 | $189,720 |
| 2023 | $3,458 | $223,250 | $33,530 | $189,720 |
| 2022 | $1,950 | $154,440 | $26,820 | $127,620 |
| 2021 | $1,950 | $154,440 | $26,820 | $127,620 |
| 2020 | $1,950 | $154,440 | $26,820 | $127,620 |
| 2019 | $1,950 | $154,440 | $26,820 | $127,620 |
| 2018 | $1,692 | $131,920 | $26,820 | $105,100 |
| 2016 | $2,027 | $158,023 | $26,820 | $131,203 |
| 2015 | $2,031 | $158,023 | $26,820 | $131,203 |
| 2014 | -- | $158,023 | $26,820 | $131,203 |
Source: Public Records
Map
Nearby Homes
- 622 Worthville St
- 516 Hillcrest Dr
- 0 Naomi Rd
- 00 Redbud Ln
- 0 Redbud Ln
- 3281 Skyhaven Rd
- 410 High Point St
- 565 Cone Estates St
- 103 Crystal Creek
- 108 Weaver St
- 0 Booker T Womble Rd
- 00 Booker T Womble Rd
- 105 Weaver St
- 4 Bradsher Ct
- 607 W Academy St
- 4377 Fox St
- 4509 Randleman Lake Rd
- 409 Pinnacle Dr
- 517 Woods Dr
- 407 Pinnacle Dr
- 511 E Brown St
- 525 E Brown St
- 601 E Brown St
- 502 E Brown St
- 500 E Brown St
- 601 Worthville St
- 608A E Brown St
- 608 E Brown St
- 525 Worthville St
- 606 E Brown St
- 609 E Brown St
- 528 Worthville St
- 521 Worthville St
- 523 Worthville St
- 433 E Brown St
- 600 Worthville St
- 611 Worthville St
- 526 Worthville St
- 617 Worthville St
- 604 Worthville St
Your Personal Tour Guide
Ask me questions while you tour the home.