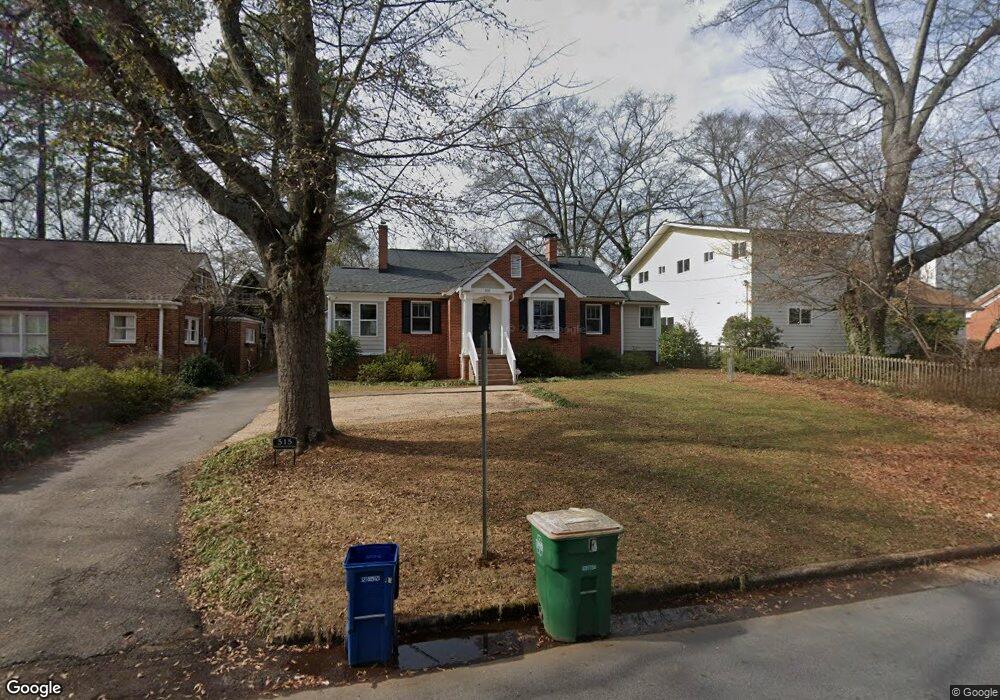
515 Holman Ave Athens, GA 30606
Normaltown NeighborhoodEstimated Value: $624,000 - $864,000
3
Beds
1
Bath
1,874
Sq Ft
$375/Sq Ft
Est. Value
About This Home
This home is located at 515 Holman Ave, Athens, GA 30606 and is currently estimated at $702,703, approximately $374 per square foot. 515 Holman Ave is a home located in Clarke County with nearby schools including Johnnie Lay Burks Elementary School, Clarke Middle School, and Clarke Central High School.
Ownership History
Date
Name
Owned For
Owner Type
Purchase Details
Closed on
Aug 14, 2015
Sold by
Lee Walton
Bought by
Ramey Katherine F
Current Estimated Value
Purchase Details
Closed on
Nov 14, 2014
Sold by
Lee Sarah E
Bought by
Lee Walton G
Purchase Details
Closed on
Apr 28, 2006
Sold by
Not Provided
Bought by
Lee Sarah E and Lee Walton G
Home Financials for this Owner
Home Financials are based on the most recent Mortgage that was taken out on this home.
Original Mortgage
$137,025
Interest Rate
6.33%
Mortgage Type
FHA
Create a Home Valuation Report for This Property
The Home Valuation Report is an in-depth analysis detailing your home's value as well as a comparison with similar homes in the area
Home Values in the Area
Average Home Value in this Area
Purchase History
| Date | Buyer | Sale Price | Title Company |
|---|---|---|---|
| Ramey Katherine F | $360,000 | -- | |
| Lee Walton G | -- | -- | |
| Lee Sarah E | -- | -- | |
| Lee Sarah E | -- | -- | |
| Lee Sarah E | -- | -- | |
| Lee Sarah E | -- | -- | |
| Lee Sarah E | $181,750 | -- |
Source: Public Records
Mortgage History
| Date | Status | Borrower | Loan Amount |
|---|---|---|---|
| Previous Owner | Lee Sarah E | $137,025 |
Source: Public Records
Tax History
| Year | Tax Paid | Tax Assessment Tax Assessment Total Assessment is a certain percentage of the fair market value that is determined by local assessors to be the total taxable value of land and additions on the property. | Land | Improvement |
|---|---|---|---|---|
| 2025 | $4,740 | $236,704 | $44,000 | $192,704 |
| 2024 | $4,740 | $220,872 | $44,000 | $176,872 |
| 2023 | $4,779 | $210,770 | $40,000 | $170,770 |
| 2022 | $4,682 | $188,718 | $40,000 | $148,718 |
| 2021 | $4,681 | $174,168 | $40,000 | $134,168 |
| 2020 | $4,571 | $166,131 | $36,000 | $130,131 |
| 2019 | $4,532 | $160,537 | $30,000 | $130,537 |
| 2018 | $4,418 | $152,406 | $30,000 | $122,406 |
| 2017 | $0 | $149,759 | $30,000 | $119,759 |
| 2016 | $4,128 | $131,585 | $30,000 | $101,585 |
| 2015 | -- | $66,835 | $26,000 | $40,835 |
| 2014 | $2,090 | $61,378 | $22,000 | $39,378 |
Source: Public Records
Map
Nearby Homes
- 375 Best Dr
- 663 Oglethorpe Ave
- 282 Holman Ave
- 215 Holman Ave
- 970 Oglethorpe Ave
- 110 Valley St
- 271 King Ave
- 105 Magnolia Terrace
- 159 Sylvia Cir
- 923 Hill St
- 1080 Oglethorpe Ave
- 342 Knottingham Dr
- 277 Evans St
- 607 Creekside Ct
- 552 Cobb St
- 140 Breckenridge Ln
- 480 N Billups St
- 1196 W Hancock Ave Unit 1
- 1198 W West Hancock Ave W
- 347 Hampton Park Dr
- 425 Holman Ave
- 545 Holman Ave
- 495 Holman Ave
- 520 Sunset Dr
- 510 Sunset Dr
- 530 Sunset Dr
- 555 Holman Ave
- 530 Holman Ave Unit Ave
- 530 Holman Ave
- 516 Holman Ave
- 540 Holman Ave
- 491 Holman Ave
- 491 Holman Ave
- 460 Sunset Dr
- 460 Holman Ave
- 550 Sunset Dr
- 565 Holman Ave
- 550 Holman Ave
- 450 Holman Ave
- 454 Sunset Dr
Your Personal Tour Guide
Ask me questions while you tour the home.