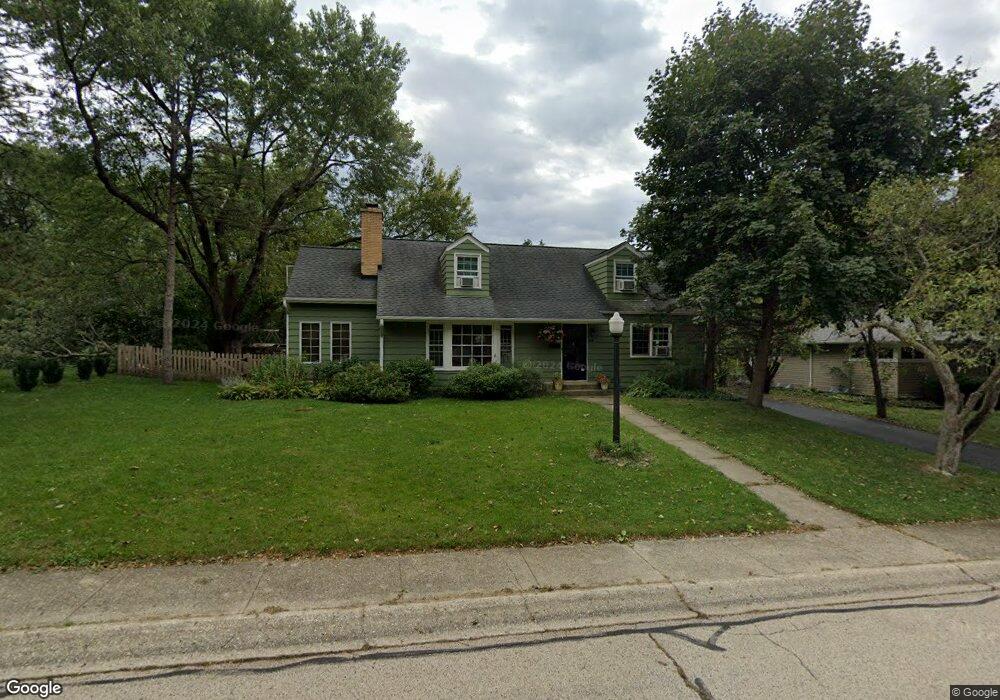
515 Lincoln St Algonquin, IL 60102
Estimated Value: $345,512 - $357,000
4
Beds
2
Baths
1,976
Sq Ft
$178/Sq Ft
Est. Value
About This Home
This home is located at 515 Lincoln St, Algonquin, IL 60102 and is currently estimated at $351,128, approximately $177 per square foot. 515 Lincoln St is a home located in McHenry County with nearby schools including Eastview Elementary School, Algonquin Middle School, and Dundee-Crown High School.
Ownership History
Date
Name
Owned For
Owner Type
Purchase Details
Closed on
Aug 4, 2010
Sold by
Fannie Mae
Bought by
Shedor Matthew W and Shedor Katrina
Current Estimated Value
Home Financials for this Owner
Home Financials are based on the most recent Mortgage that was taken out on this home.
Original Mortgage
$160,115
Outstanding Balance
$106,172
Interest Rate
4.6%
Mortgage Type
VA
Estimated Equity
$244,956
Purchase Details
Closed on
May 6, 2010
Sold by
Atherton
Bought by
Federal National Mortgage Association
Purchase Details
Closed on
Oct 7, 2005
Sold by
Gustafson Robert M and Gustafson Jody B
Bought by
Atherton Carey
Home Financials for this Owner
Home Financials are based on the most recent Mortgage that was taken out on this home.
Original Mortgage
$199,000
Interest Rate
6.48%
Mortgage Type
Fannie Mae Freddie Mac
Create a Home Valuation Report for This Property
The Home Valuation Report is an in-depth analysis detailing your home's value as well as a comparison with similar homes in the area
Home Values in the Area
Average Home Value in this Area
Purchase History
| Date | Buyer | Sale Price | Title Company |
|---|---|---|---|
| Shedor Matthew W | $155,000 | Attorneys Title Guaranty Fun | |
| Federal National Mortgage Association | $223,974 | None Available | |
| Atherton Carey | $255,000 | Nlt Title Llc |
Source: Public Records
Mortgage History
| Date | Status | Borrower | Loan Amount |
|---|---|---|---|
| Open | Shedor Matthew W | $160,115 | |
| Previous Owner | Atherton Carey | $199,000 |
Source: Public Records
Tax History Compared to Growth
Tax History
| Year | Tax Paid | Tax Assessment Tax Assessment Total Assessment is a certain percentage of the fair market value that is determined by local assessors to be the total taxable value of land and additions on the property. | Land | Improvement |
|---|---|---|---|---|
| 2024 | $7,146 | $99,355 | $14,133 | $85,222 |
| 2023 | $6,769 | $88,860 | $12,640 | $76,220 |
| 2022 | $6,247 | $78,848 | $19,523 | $59,325 |
| 2021 | $5,986 | $73,456 | $18,188 | $55,268 |
| 2020 | $5,824 | $70,855 | $17,544 | $53,311 |
| 2019 | $5,676 | $67,817 | $16,792 | $51,025 |
| 2018 | $5,399 | $62,648 | $15,512 | $47,136 |
| 2017 | $5,280 | $59,018 | $14,613 | $44,405 |
| 2016 | $5,190 | $55,354 | $13,706 | $41,648 |
| 2013 | -- | $59,244 | $12,786 | $46,458 |
Source: Public Records
Map
Nearby Homes
- 102 Center St
- 0 River Dr N Unit MRD12473279
- 600 E Algonquin Rd
- 2 Sunset Ln
- 314 Washington St
- 0 Natoma Trail
- 69 Alice St
- 1245 Winaki Trail
- 1188 E Algonquin Rd
- lot 25 Wabican Trail
- 420 N Harrison St
- 911 Old Oak Cir Unit 1
- 1114 Riverwood Dr Unit 1114
- 903 Old Oak Cir
- 920 Plymouth Ct
- 9999 Sandbloom Rd
- 925 N River Rd
- 1659 E Algonquin Rd
- 620 Old Oak Cir
- Lot 4 b Ryan Pkwy