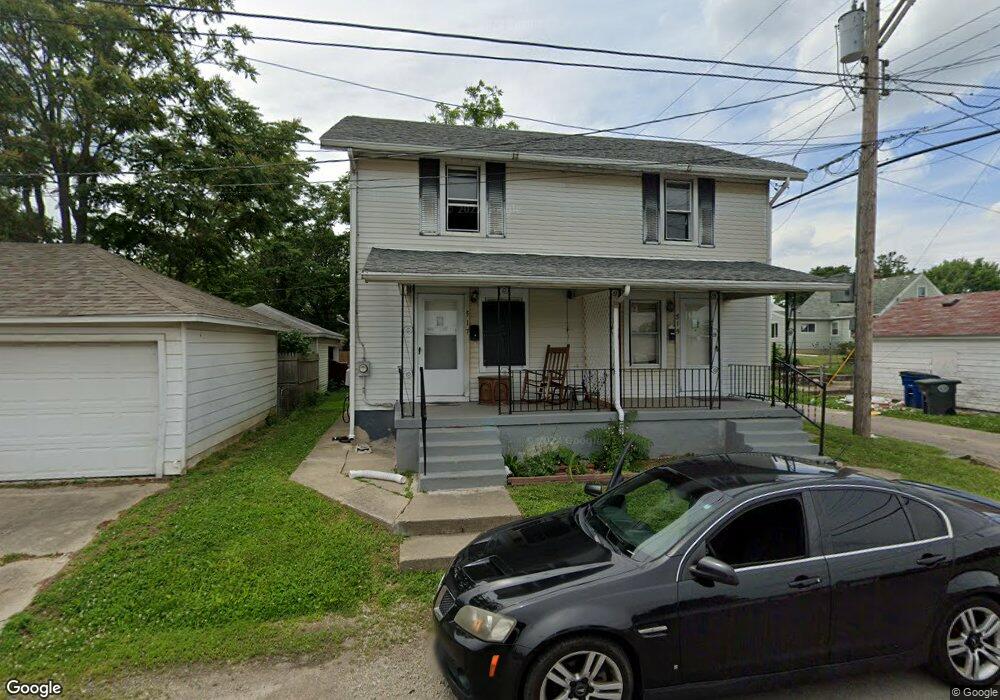
515 Mertland Ave Dayton, OH 45403
Eastern Hills NeighborhoodEstimated Value: $131,432 - $140,000
4
Beds
2
Baths
1,752
Sq Ft
$78/Sq Ft
Est. Value
About This Home
This home is located at 515 Mertland Ave, Dayton, OH 45403 and is currently estimated at $136,108, approximately $77 per square foot. 515 Mertland Ave is a home located in Montgomery County with nearby schools including Cleveland Elementary School, Eastmont Elementary, and Horace Mann Elementary School.
Ownership History
Date
Name
Owned For
Owner Type
Purchase Details
Closed on
Jan 14, 2023
Sold by
Thomas Family Trust
Bought by
Thomas Renny
Current Estimated Value
Purchase Details
Closed on
Jun 16, 2021
Sold by
Century Investments Llc
Bought by
Thomas Marlene Elizabeth and The Thomas Family Trust
Purchase Details
Closed on
Feb 29, 2016
Sold by
Aldineh Homes Llc
Bought by
Century Investments Llc
Purchase Details
Closed on
Feb 19, 2014
Sold by
Fannie Mae
Bought by
Aldineh Homes Llc
Purchase Details
Closed on
Dec 5, 2013
Sold by
Keipper Kevin C and Huntington National Bank
Bought by
Fannie Mae and Federal National Mortgage Association
Purchase Details
Closed on
May 22, 1998
Sold by
Collins Clifford G and Collins Geraldine
Bought by
Keipper Kevin C
Purchase Details
Closed on
Apr 3, 1997
Sold by
Collins Geraldine
Bought by
Collins Clifford G and Collins Geraldine
Create a Home Valuation Report for This Property
The Home Valuation Report is an in-depth analysis detailing your home's value as well as a comparison with similar homes in the area
Home Values in the Area
Average Home Value in this Area
Purchase History
| Date | Buyer | Sale Price | Title Company |
|---|---|---|---|
| Thomas Renny | $62,200 | None Listed On Document | |
| Thomas Marlene Elizabeth | $90,000 | Columbus Ttl Agcy Of Westerv | |
| Century Investments Llc | $14,000 | Fidelity Lawyers Title Agenc | |
| Aldineh Homes Llc | -- | Fidelity Lawyers Title Agenc | |
| Fannie Mae | $24,000 | None Available | |
| Keipper Kevin C | $52,500 | -- | |
| Collins Clifford G | -- | -- |
Source: Public Records
Tax History Compared to Growth
Tax History
| Year | Tax Paid | Tax Assessment Tax Assessment Total Assessment is a certain percentage of the fair market value that is determined by local assessors to be the total taxable value of land and additions on the property. | Land | Improvement |
|---|---|---|---|---|
| 2024 | $1,896 | $32,480 | $3,490 | $28,990 |
| 2023 | $1,896 | $32,480 | $3,490 | $28,990 |
| 2022 | $1,827 | $24,180 | $2,600 | $21,580 |
| 2021 | $1,817 | $24,180 | $2,600 | $21,580 |
| 2020 | $1,813 | $24,180 | $2,600 | $21,580 |
| 2019 | $922 | $10,650 | $2,600 | $8,050 |
| 2018 | $923 | $10,650 | $2,600 | $8,050 |
| 2017 | $917 | $10,650 | $2,600 | $8,050 |
| 2016 | $978 | $10,860 | $2,600 | $8,260 |
| 2015 | $928 | $10,860 | $2,600 | $8,260 |
| 2014 | $928 | $10,860 | $2,600 | $8,260 |
| 2012 | -- | $19,970 | $3,470 | $16,500 |
Source: Public Records
Map
Nearby Homes
- 1626 Darst Ave
- 1730 Darst Ave
- 520 S Smithville Rd
- 1614 Huffman Ave Unit 1612
- 1629 Suman Ave
- 404 S Smithville Rd
- 1700 Suman Ave
- 1800 Darst Ave
- 1815 Huffman Ave
- 420 Dawnview Ave
- 1714 Gondert Ave
- 1620 Gondert Ave Unit 1618
- 1620 Gondert Ave
- 515 Heiss Ave Unit 515-517
- 521 Pollock Rd
- 1921 Emerald Ct
- 715 Gondert Ave
- 108 Big Pine Rd
- 511 S Hayden Ave
- 4533 Maughn Dr
- 1669 Huffman Ave
- 1673 Huffman Ave
- 1665 Huffman Ave
- 1670 Darst Ave
- 1661 Huffman Ave
- 1701 Huffman Ave
- 1658 Darst Ave
- 1657 Huffman Ave
- 1705 Huffman Ave
- 504 Mertland Ave
- 504 Mertland Ave Unit 4
- 504 Mertland Ave
- 1653 Huffman Ave
- 1709 Huffman Ave
- 1706 Darst Ave
- 1649 Huffman Ave
- 1715 Huffman Ave
- 1646 Darst Ave
- 1645 Huffman Ave
- 1719 Huffman Ave