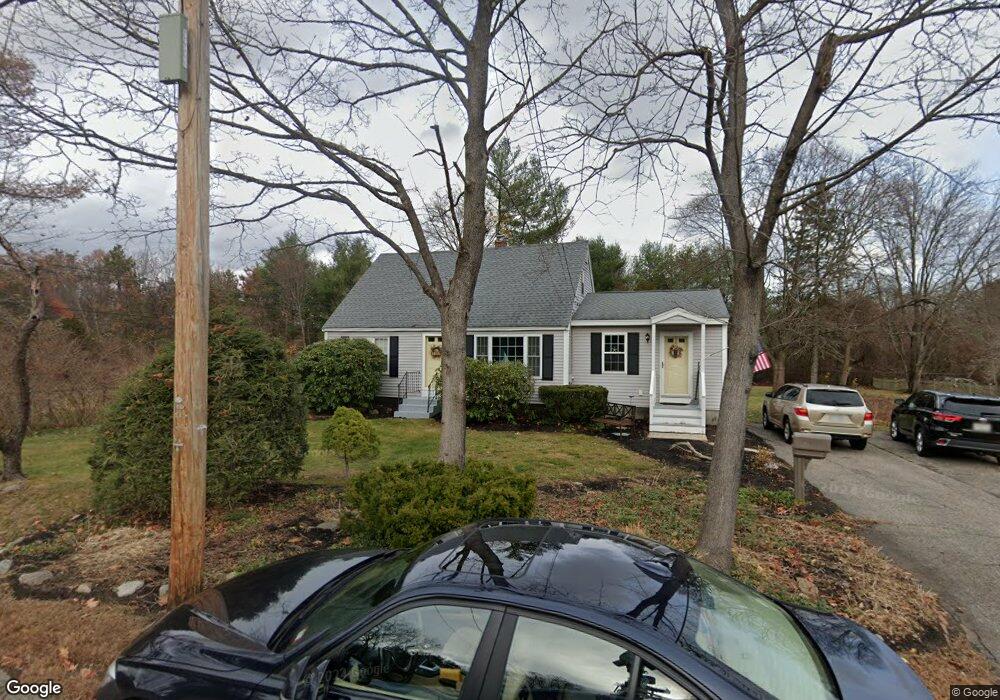
515 Sherburne Rd Portsmouth, NH 03801
Estimated Value: $603,000 - $857,000
2
Beds
1
Bath
1,414
Sq Ft
$493/Sq Ft
Est. Value
About This Home
This home is located at 515 Sherburne Rd, Portsmouth, NH 03801 and is currently estimated at $696,629, approximately $492 per square foot. 515 Sherburne Rd is a home located in Rockingham County with nearby schools including New Franklin School, Portsmouth Middle School, and Portsmouth High School.
Ownership History
Date
Name
Owned For
Owner Type
Purchase Details
Closed on
Jul 18, 1985
Bought by
Thurber George D and Thurber Julie A
Current Estimated Value
Create a Home Valuation Report for This Property
The Home Valuation Report is an in-depth analysis detailing your home's value as well as a comparison with similar homes in the area
Home Values in the Area
Average Home Value in this Area
Purchase History
| Date | Buyer | Sale Price | Title Company |
|---|---|---|---|
| Thurber George D | -- | -- |
Source: Public Records
Mortgage History
| Date | Status | Borrower | Loan Amount |
|---|---|---|---|
| Open | Thurber George D | $50,000 |
Source: Public Records
Tax History Compared to Growth
Tax History
| Year | Tax Paid | Tax Assessment Tax Assessment Total Assessment is a certain percentage of the fair market value that is determined by local assessors to be the total taxable value of land and additions on the property. | Land | Improvement |
|---|---|---|---|---|
| 2024 | $6,138 | $549,000 | $273,600 | $275,400 |
| 2023 | $5,637 | $349,500 | $165,900 | $183,600 |
| 2022 | $5,312 | $349,500 | $165,900 | $183,600 |
| 2021 | $5,253 | $349,500 | $165,900 | $183,600 |
| 2020 | $5,138 | $349,500 | $165,900 | $183,600 |
| 2019 | $5,194 | $349,500 | $165,900 | $183,600 |
| 2018 | $4,994 | $315,300 | $150,800 | $164,500 |
| 2017 | $4,849 | $315,300 | $150,800 | $164,500 |
| 2016 | $4,539 | $266,400 | $132,000 | $134,400 |
| 2015 | $4,473 | $266,400 | $132,000 | $134,400 |
| 2014 | $4,818 | $266,200 | $139,300 | $126,900 |
| 2013 | $4,033 | $225,200 | $139,300 | $85,900 |
| 2012 | $3,951 | $225,100 | $139,300 | $85,800 |
Source: Public Records
Map
Nearby Homes
- 7 Hall Ct
- 6 Shipwright Way
- 283 Decatur Rd
- 166 Decatur Rd
- 291 Colonial Dr
- 255 Melbourne St
- 777 Middle Rd Unit 45
- Lot 44 Sims Ave
- 15 Woodworth Ave
- 88 Farm Ln
- 1230 Islington St
- 41 Newington Rd
- 171 Echo Ave
- 6 Boyd Rd
- 216 Woodbury Ave
- 224 Cate St
- 50 Cate St Unit 4
- 1338 Woodbury Ave Unit 10
- 25 Morning St
- #7 Woodbury Reserve Rd Unit 7
- 507 Sherburne Rd
- 510 Sherburne Rd
- 476 Sherburne Rd
- 19 Doris Ave
- 460 Sherburne Rd
- 469 Sherburne Rd
- 20 Witmer Ave
- 29 Doris Ave
- 260 Holly Ln
- 456 Sherburne Rd
- 252 Holly Ln
- 20 Doris Ave
- 443 Sherburne Rd
- 274 Holly Ln
- 582 Greenside Ave
- 246 Holly Ln
- 28 Doris Ave
- 436 Sherburne Rd
- 27 Sutton Ave
- 576 Greenside Ave