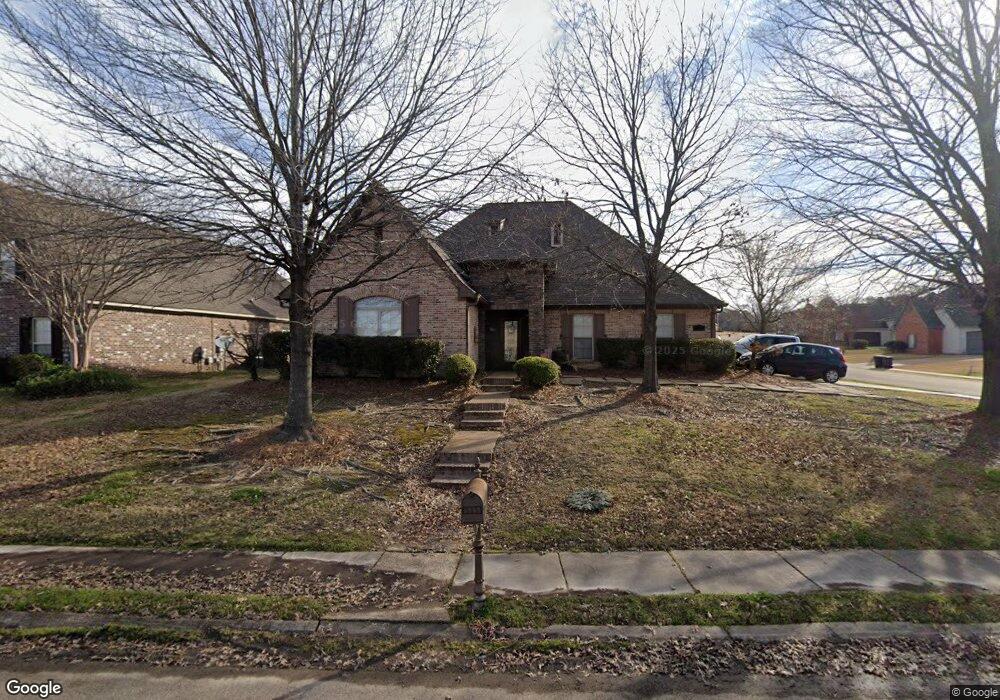
515 Turtle Ln Brandon, MS 39047
Estimated Value: $330,613 - $371,000
4
Beds
3
Baths
2,350
Sq Ft
$149/Sq Ft
Est. Value
About This Home
This home is located at 515 Turtle Ln, Brandon, MS 39047 and is currently estimated at $350,403, approximately $149 per square foot. 515 Turtle Ln is a home located in Rankin County with nearby schools including Highland Bluff Elementary School, Northwest Rankin Middle School, and Northwest Rankin High School.
Ownership History
Date
Name
Owned For
Owner Type
Purchase Details
Closed on
Jun 8, 2017
Sold by
Braud Lionel L and Braud Betty H
Bought by
Henderson Dean and Henderson Susan
Current Estimated Value
Home Financials for this Owner
Home Financials are based on the most recent Mortgage that was taken out on this home.
Original Mortgage
$292,979
Outstanding Balance
$240,957
Interest Rate
4.05%
Mortgage Type
FHA
Estimated Equity
$109,446
Purchase Details
Closed on
Aug 19, 2011
Sold by
Sue D Sue D and Peden Derryl
Bought by
Braud Lionel L and Braud Betty H
Home Financials for this Owner
Home Financials are based on the most recent Mortgage that was taken out on this home.
Original Mortgage
$248,535
Interest Rate
4.5%
Mortgage Type
FHA
Purchase Details
Closed on
Jul 6, 2007
Sold by
Ewing-Parrow Construction Inc
Bought by
Peden Sue D and Davis Mary Y
Home Financials for this Owner
Home Financials are based on the most recent Mortgage that was taken out on this home.
Original Mortgage
$255,000
Interest Rate
6.52%
Create a Home Valuation Report for This Property
The Home Valuation Report is an in-depth analysis detailing your home's value as well as a comparison with similar homes in the area
Purchase History
| Date | Buyer | Sale Price | Title Company |
|---|---|---|---|
| Henderson Dean | -- | None Available | |
| Braud Lionel L | -- | -- | |
| Peden Sue D | -- | -- |
Source: Public Records
Mortgage History
| Date | Status | Borrower | Loan Amount |
|---|---|---|---|
| Open | Henderson Dean | $292,979 | |
| Previous Owner | Braud Lionel L | $248,535 | |
| Previous Owner | Peden Sue D | $255,000 |
Source: Public Records
Tax History
| Year | Tax Paid | Tax Assessment Tax Assessment Total Assessment is a certain percentage of the fair market value that is determined by local assessors to be the total taxable value of land and additions on the property. | Land | Improvement |
|---|---|---|---|---|
| 2025 | $4,072 | $35,862 | $0 | $0 |
| 2024 | $3,862 | $35,862 | $0 | $0 |
| 2023 | $4,193 | $35,448 | $0 | $0 |
| 2022 | $4,140 | $35,448 | $0 | $0 |
| 2021 | $4,190 | $35,448 | $0 | $0 |
| 2020 | $4,215 | $35,448 | $0 | $0 |
| 2019 | $3,884 | $21,006 | $0 | $0 |
| 2018 | $2,712 | $21,006 | $0 | $0 |
| 2017 | $1,932 | $21,006 | $0 | $0 |
| 2016 | $1,804 | $20,415 | $0 | $0 |
| 2015 | $1,804 | $20,415 | $0 | $0 |
| 2014 | -- | $20,415 | $0 | $0 |
| 2013 | -- | $20,415 | $0 | $0 |
Source: Public Records
Map
Nearby Homes
- 813 Terrapin Ln
- 539 Turtle Ln
- 314 Turtle Hollow
- 242 Huntington Hollow
- 169 Bellegrove Cir
- 206 Huntington Hollow
- 408 Pinebrook Cir
- 228 Huntington Hollow
- 109 Brandy Run Rd
- 300 Deer Hollow
- 191 Bellegrove Cir
- 14 Brandy Ct S
- 1 Brandy Village Cove
- 231 Bronson Bend
- 126 Plum Tree Rd
- 735 Cotton Creek Trail
- 241 Bronson Bend
- 215 Bronson Bend
- 154 Cumberland Rd
- 230 Bronson Bend
- 515 Turtle Lane Dr
- 515 Turtle Ln Unit ( lot 138)
- 513 Turtle Ln
- 511 Turtle Ln
- 800 Terrapin Ln
- 516 Turtle Ln
- 518 Turtle Ln
- 518 Turtle Ln Unit (lot 84)
- 802 Terrapin Ln
- 702 Tortoise Ridge
- 514 Turtle Ln
- 520 Turtle Ln
- 804 Terrapin Ln
- 509 Turtle Ln
- 509 Turtle Ln Unit (LOT 157)
- 512 Turtle Ln
- 807 Terrapin Ln
- 522 Turtle Ln
- 706 Tortoise Ridge Dr
- 706 Tortoise Ridge
Your Personal Tour Guide
Ask me questions while you tour the home.