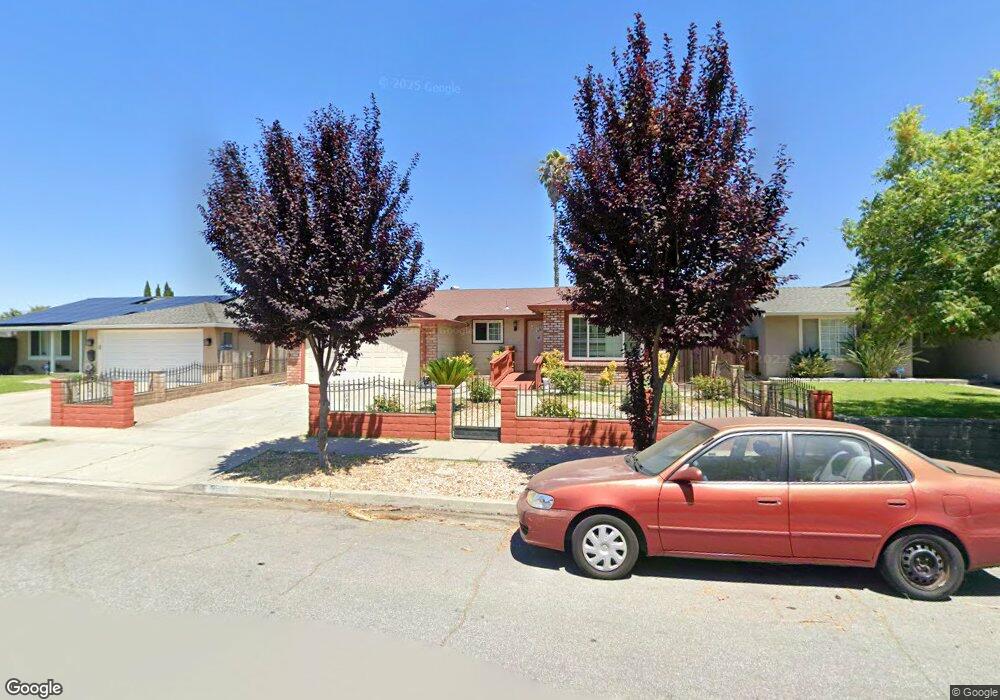
515 Tuscarora Dr San Jose, CA 95123
Oak Ridge NeighborhoodEstimated Value: $1,339,000 - $1,698,000
5
Beds
3
Baths
1,495
Sq Ft
$1,021/Sq Ft
Est. Value
About This Home
This home is located at 515 Tuscarora Dr, San Jose, CA 95123 and is currently estimated at $1,526,153, approximately $1,020 per square foot. 515 Tuscarora Dr is a home located in Santa Clara County with nearby schools including Herman (Leonard) Intermediate School, Oak Ridge Elementary School, and Santa Teresa High School.
Ownership History
Date
Name
Owned For
Owner Type
Purchase Details
Closed on
Aug 1, 2006
Sold by
Ortega Lucio A and Garcia Graciela
Bought by
Pendar Marie
Current Estimated Value
Home Financials for this Owner
Home Financials are based on the most recent Mortgage that was taken out on this home.
Original Mortgage
$141,000
Outstanding Balance
$84,654
Interest Rate
6.76%
Mortgage Type
Stand Alone Second
Estimated Equity
$1,441,499
Purchase Details
Closed on
Apr 11, 2000
Sold by
Merrell Thomas H and Merrell Karen W
Bought by
Ortega Lucio A and Garcia Graciela
Home Financials for this Owner
Home Financials are based on the most recent Mortgage that was taken out on this home.
Original Mortgage
$314,400
Interest Rate
8.24%
Mortgage Type
Stand Alone First
Create a Home Valuation Report for This Property
The Home Valuation Report is an in-depth analysis detailing your home's value as well as a comparison with similar homes in the area
Home Values in the Area
Average Home Value in this Area
Purchase History
| Date | Buyer | Sale Price | Title Company |
|---|---|---|---|
| Pendar Marie | $705,000 | Fidelity National Title Co | |
| Ortega Lucio A | $393,000 | Old Republic Title Company |
Source: Public Records
Mortgage History
| Date | Status | Borrower | Loan Amount |
|---|---|---|---|
| Open | Pendar Marie | $141,000 | |
| Open | Pendar Marie | $564,000 | |
| Previous Owner | Ortega Lucio A | $314,400 |
Source: Public Records
Tax History Compared to Growth
Tax History
| Year | Tax Paid | Tax Assessment Tax Assessment Total Assessment is a certain percentage of the fair market value that is determined by local assessors to be the total taxable value of land and additions on the property. | Land | Improvement |
|---|---|---|---|---|
| 2025 | $14,848 | $1,040,324 | $661,178 | $379,146 |
| 2024 | $14,848 | $1,019,926 | $648,214 | $371,712 |
| 2023 | $14,620 | $999,928 | $635,504 | $364,424 |
| 2022 | $14,513 | $980,323 | $623,044 | $357,279 |
| 2021 | $14,288 | $961,102 | $610,828 | $350,274 |
| 2020 | $13,925 | $951,248 | $604,565 | $346,683 |
| 2019 | $13,583 | $932,597 | $592,711 | $339,886 |
| 2018 | $13,483 | $914,312 | $581,090 | $333,222 |
| 2017 | $12,369 | $825,000 | $524,300 | $300,700 |
| 2016 | $11,678 | $801,000 | $509,000 | $292,000 |
| 2015 | $11,758 | $678,000 | $430,900 | $247,100 |
| 2014 | $8,805 | $660,000 | $419,500 | $240,500 |
Source: Public Records
Map
Nearby Homes
- 482 Calero Ave
- 5991 Sorrel Ave
- 6161 Iowa Dr
- 625 Kiowa Cir
- 415 Conestoga Way
- 579 Suisse Dr
- 379 Roan St
- 5834 Santa Teresa Blvd
- 6298 Snell Ave
- 6129 Glen Harbor Dr
- 5857 Blossom Ave
- 6239 Mahan Dr
- 5806 Blossom Ave
- 729 Calero Ave
- 529 Galen Dr
- 471 Tovar Dr
- 5665 Comanche Dr
- 5865 Paddon Cir
- 5850 Chesbro Ave
- 731 Los Huecos Dr
- 513 Tuscarora Dr
- 517 Tuscarora Dr
- 5978 Snell Ave
- 5991 Tuscarora Ct
- 511 Tuscarora Dr
- 5970 Snell Ave
- 5983 Tuscarora Ct
- 516 Tuscarora Dr
- 514 Tuscarora Dr
- 518 Tuscarora Dr
- 512 Tuscarora Dr
- 5962 Snell Ave
- 5975 Tuscarora Ct
- 510 Tuscarora Dr
- 5989 Snell Ave
- 5997 Snell Ave
- 507 Tuscarora Dr
- 5981 Snell Ave
- 5954 Snell Ave
- 6025 Shawcroft Dr